Ichimoku s Day Trading Strategy With The Primary Trend
Post on: 15 Апрель, 2015 No Comment

Article Summary: The concepts of Ichimoku can be applied across the board on all time frames. Short term traders can take the same rules and apply them to their time frame for holding a trade. However, there are two key aspects you should focus on with short term trading.
If youre going to panic, panic early.
-Wall Street Proverb
Trading short term has many real benefits if youre comfortable with the seemingly erratic moves. Ichimoku provides a guiding light on trading in the direction of the trend but when you go down to a shorter time frame, a few key aspects of Ichimoku become exceedingly important. Here is a breakdown on what to focus on when trading on a shorter term time-frame, like a 5-minute chart or one of its kin.
Trading In the Moment
Naturally, when trading with Ichimoku we advise that you always start with the cloud. The cloud has no mystic power that can predict what the market will do, but rather works to keep the odds in your favor by trading with a perception that the trend will most likely continue. Trend continuation is the most likely while never guaranteed outcome of the markets.
The Lagging Line & Base Line
Beyond the cloud, the two key aspects of Ichimoku you can focus on are the lagging line and the base line. The lagging line is seen as our momentum indicator and when the lagging line breaks upward or downward, we have confirmation to join the days trend. The base line is the longer term moving average and a crossover of price in the direction of the overall trend is a strong confirmation of trend continuation.
The lagging line acting as a momentum indicator is often a novel thought. However, momentum is simply a tool to tell us if the current moves is likely, while not guaranteed, to continue. When the lagging line confirms the trade by breaking through the cloud or price as resistance, which is often a good time to enter a trade with appropriate risk management. Click here if youd like access to watch a free lesson on advanced risk management.
Learn Forex: Short Term USDJPY with Lagging Line Confirmation
Presented by FXCMs Marketscope Charts
When the lagging line breaks out, it will often do so by entering into open space. Simply put, open space means that in a downtrend, there is nothing supporting price and it will likely continue to fall until selling pressure lets off the gas. In an uptrend, the lagging line breaking to the upside shows no resistance and you can ride the trend until buying pressure is exhausted which can be seen by the lagging line moving to the other side of the cloud.
Learn Forex: Lagging Line Day Trade Higher Shows Exhaustion / Exit When Lagging Line Flips
Presented by FXCMs Marketscope Charts
Did You Miss The Initial Blast Off?
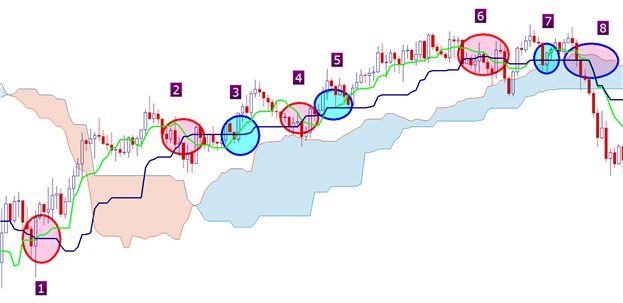
If you missed moment when the lagging line breaks out in the direction of the trend, hope is not lost. You can simply wait for price to come back to the base line and then push back in the direction of the trend. If youre not sure how to identify a signal once price comes back to the signal line, you can look to a candlestick signal that is showing continuation.
Learn Forex: Wait for the Market to Show You the Trend Is Continuing With A Baseline Cross
Presented by FXCMs Marketscope Charts
Ichimoku Weekly Trade: Buy NZD JPY if Price Breaks Above the Base Line Showing Continuation
Ichimoku Trade: Buy NZDJPY If Price Breaks Through the Base Line at 79.35 To The Upside
Stop: 78.35 ( Support with Bottom of Cloud)
Limit: 83.50 (Profit Target Based on Retracement toward Prior Low)
-Full Candle Bodies above the Kumo Cloud
-The trigger line (black) is above the base line (light blue) or is crossing below
-Lagging line is above p rice action from 26 periods ago.
-Kumo ahead of price is bullish and rising ( blue cloud = bullish Kumo)
Ichimoku is a dynamic tool that can be used on multiple time frames effectively. Regardless of the time frame, Ichimoku can help you see when a trend is likely to continue and help you recognize a good price to enter based on when price and the lagging line break through the clo u d or price crosses the base line. On the chart above, the NZD JPY trend is looking for some support and if the trend continues we can bene f i t from a great buy trade at a good price in relation to our risk levels.
Happy Trading!
Prior Ichimoku Articles:
—Written by Tyler Yell, Trading Instructor
To contact Tyler, email tyell@fxcm.com.
To be added to Tylers e-mail distribution list, please click here.
Become a Smarter Trader Today
Learn How To Read Price Action Signals As They Develop. This free lesson will show you the power of price action as displayed in candlesticks. The power of this tool has been used for decades and were all too happy to introduce it to you at no cost in order to assist your trading.
DailyFX provides forex news and technical analysis on the trends that influence the global currency markets.
Learn forex trading with a free practice account and trading charts from FXCM.


