How to Use the Rectangles and Flags Chart Pattern in Forex Trading
Post on: 11 Апрель, 2015 No Comment

Rectangles are among the continuation chart patterns. Like the symmetrical triangles. there are two kinds of rectangles. A rectangle formed at the end of an uptrend is called bullish rectangle. And a rectangles formed at the end of a downtrend is called bearish rectangle .
When we say that rectangles are continuation patterns it means the trend. either uptrend or downtrend, will be continued after a rectangle.
Bullish and Bearish Rectangles
Now the question is why a pattern like rectangle or triangle forms on a trend ?
The answer is that when the price goes up or down strongly and forms an uptrend or downtrend, after a while the market becomes exhausted because buyers who caused the price to go up, or sellers who caused the price to go down, will stop buying and selling. Many of them who have made profit will close their positions and collect their profit. These actions causes the market to stop moving strongly and form consolidations and patterns like triangles and rectangles. However, usually after a while the trend will be continued.
This is all related to the psychology of the buyers and sellers. When most people think that the price will go up, it will really go up because people will buy. When there is a high demand to buy a special commodity, its price will go up. Similarly, when most people think that the price will go down, it will go down because most people sell. When most people like to sell a commodity, its price will go down. In Forex market, the price will go up only when people think that it will go up and so they buy. By people I mean all the buyers and seller. All of those who buy and sell in Forex market. It varies from the retail traders to big banks. hedge funds and financial institutions.
Anyway. Lets talk about the rectangles.
Forex market is so volatile and liquid. Therefore, patterns like triangles can be rarely seen on the forex market. For trading the rectangles, we follow the same rules that we learned when discussing about the triangles. It means, although it is said that rectangles are continuation patterns, we should wait for a breakout to take the position, because it is always possible that the market doesnt follow the rule and it reverses instead of continuing the trend.
Therefore, although the rule says that a rectangle in an uptrend will break above and the uptrend will be continued, we should always wait for the rectangle resistance breakout to go long. Similarly, we should always wait for the rectangle support breakout on a downtrend to go short.
Now lets take a look at some examples. Click on the images to see them in full size:
Bullish Rectangle on EUR/USD 5min Chart

Where Should You Set the Stop Loss?
It is the same as the triangles breakouts. When you go short, you set the stop loss above the candlestick that has broken below the rectangle support. And when you go long, you set the stop loss below the candlestick which has broken above the rectangle resistance :
This is how to set the stop loss when you enter after the rectangle resistance breakout.
Flags:
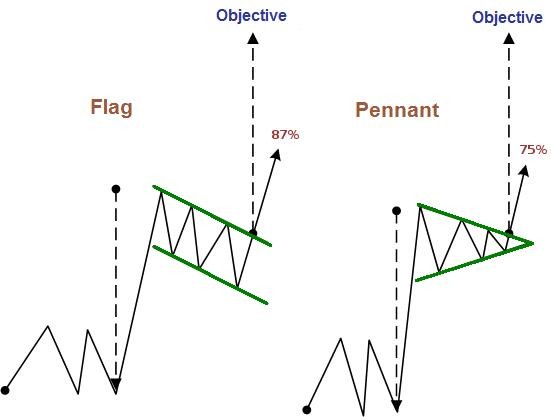
Flag chart pattern is in fact the small bullish or bearish rectangle. It is just smaller than rectangle. Everything, including the trading rules is the same with rectangles.
Something that you should note is that you should not expect to see the flag chart pattern too often on forex market. The reason is that the forex market is too liquid, volatile and strong, and so, small patterns like flags, pennants and wedges can rarely be seen on this market. Big and strong patterns like triangles, head and shoulders. rectangles, saucer & handle, channels, butterfly and bat patterns can be seen on the forex market more frequently.


