How to Trade with RSI in the FX Market
Post on: 20 Май, 2015 No Comment

As traders further their education of Technical Analysis, they will often begin a journey on the path of indicators. On this path are many indicators, with many functions, uses and goals.
Some indicators may seem to work better than others depending on the traders goals; leading to the rampant popularity of many of the most popular indicators. However, something that must be made clear:
A wise trader once told me that indicators are just a form of a fancy moving average. Sure enough, indicators use past price movements to build their indicator value; much like a moving average.
And since past prices cant predict future price movements, what can a convoluted interpretation of those past movements (such as that of an indicator) do for a trader?
Well, while indicators will never be perfectly predictive of future price movements they can certainly help traders build an approach based on probabilities in an effort to get what they want out of the market.
In this article, we are going to discuss one of the more popular indicators in Technical Analysis: RSI, or the Relative Strength Index.
What Goes into RSI?
The Relative Strength Index is going to measure price changes over the past X periods (with X being the input that you can enter into the indicator.)
If you set RSI of 5 periods, it will measure the strength of this candles price movement against the previous 4 (for a total of the last 5 periods). If you use RSI at 55 periods, you will be measuring this candles strength or weakness to the last 54 periods. The more periods you use, the slower the indicator will appear to react to recent price changes.
The picture below will show 2 RSI indicators: The top RSI is set with 5 periods, and the bottom at 55 periods. Notice how much more erratic the 5 periods RSI is compared to the 55 periods. This is because the indicator is changing so much faster due to the fewer inputs used to calculate its value.
RSI of 55 periods (on bottom in blue) and RSI of 5 periods (above in red)
What can RSI tell us?
As an oscillator, RSI will read a value between one and 100, and will tell us how strong or weak price has been over the observed number of periods. If RSI is reading below 30, traders will often construe that to mean that price action has been weak, and the asset being charted may be oversold.
If RSI is reading above 70, then price action has been strong, and price may potentially be over-bought.
Created with Marketscope/Trading Station
Basic Usage of RSI
Because the indicator can show potentially over-bought or over-sold conditions, traders will often take this a step further to look for potential price reversals.
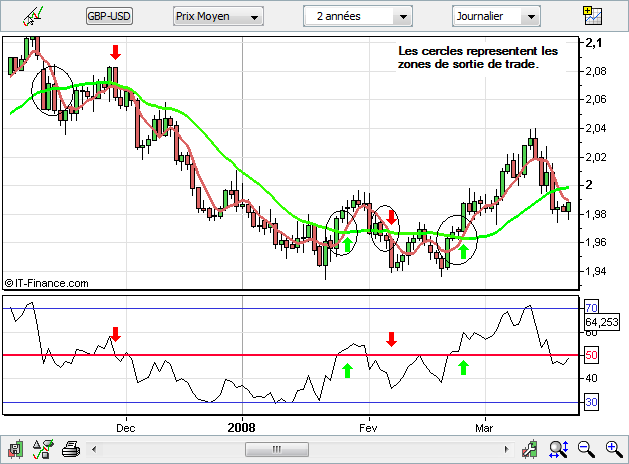
The most basic usage of RSI is looking to buy when price crosses up and over the 30 level, with the thought that price may be moving out of oversold territory with buying strength as price was previously taken too low. The picture below will illustrate further:
Created with Marketscope/Trading Station
Pit-falls of Trading with RSI
Inherently, the Relative Strength Index presents a flaw to traders attempting to employ the basic usage of the indicator.
RSI, by its nature, looks for reversals in price. By buying when RSI crosses above 30 or over-sold, traders are buying a market that has already been going down; inherently a counter-trend trade. And if a trader is selling as RSI crosses below 70, the market has been going up enough to be over-bought and the trader is initiating a sell position.
If the market is ranging, this can be a desirable trait in an indicator, as traders can often look to initiate entries in a range with RSI. However, if the market is ranging, the results can be unfavorable as price continues moving in the trending direction, leaving traders that had opened trades in the opposite direction in a compromised position. The picture below will illustrate this situation further:
Created with Marketscope/Trading Station
As you can see in the above graphic, price was trending up very heavily when four different RSI sell triggers occurred (all circled in red). Despite the fact that these sell triggers took place, price continued trending higher. If traders had opened short positions with these triggers, they would be in the precarious position of managing a losing trade.
Perhaps more troubling is the fact that some traders may not be using stops on their trading positions, and the trader looking to sell an over-bought market because RSI had moved below 70, may find significant trading losses as the strength that originally caused the indicator to read above 70 continues to carry prices higher.
When trading with RSI, risk management is of the upmost importance as trends can develop from ranges, and prices can move against the trader for an extended period of time.
In our next article, well look at how traders can attempt to off-set this pitfall of RSI when trading in trend strategies.
— Written by James B. Stanley
To contact James Stanley, please email Instructor@DailyFX.Com. You can follow James on Twitter @JStanleyFX.
To join James Stanleys distribution list, please click here .
New to the FX market? Save hours in figuring out what FOREX trading is all about.
Take this free 20 minute New to FX course presented by DailyFX Education. In the course, you will learn about the basics of a FOREX transaction, what leverage is, and how to determine an appropriate amount of leverage for your trading.
Register HERE to start your FOREX trading now!
DailyFX provides forex news and technical analysis on the trends that influence the global currency markets.
Learn forex trading with a free practice account and trading charts from FXCM.


