How To Trade The Head and Shoulders Pattern
Post on: 24 Май, 2015 No Comment

By Richard Hill on June 14th, 2011
From time to time, forex can make you scratch your head
It’s like I was saying last week sometimes, the markets seem almost random.
But other times, the patterns are so obvious that they seem to scream out at you from the charts.
Here’s just one example: the EUR/USD 30-minute chart from last Wednesday morning.
Does anything jump out at you when you look at this chart? If not, then hopefully it will by the end of this email.
I mean, let’s take a closer look
Download your FREE ‘Three Essential
Forex Indicators’ report today!
Inside your free report, you’ll discover an easy-to-use guide to three technical indicators with the power to seriously improve your trading and change the way you make money from forex.
And, you’ll also receive a free subscription to Forex Round-Up — the hugely informative forex newsletter that’s an essential read for ANY trader, new or old.
I respect your privacy and will never pass on your email address to anyone else.
As you can see, the market climbs quickly on the left hand side before retracing.
But then, it begins to climb again and hits a new high point which I’ve marked with the upper horizontal red line.
After that, it falls back to the previous retracement level which I’ve marked by the lower red line.
Then, it makes another attempt at going higher
But it’s soon rejected again, before finally heading sharply back down to the starting level.
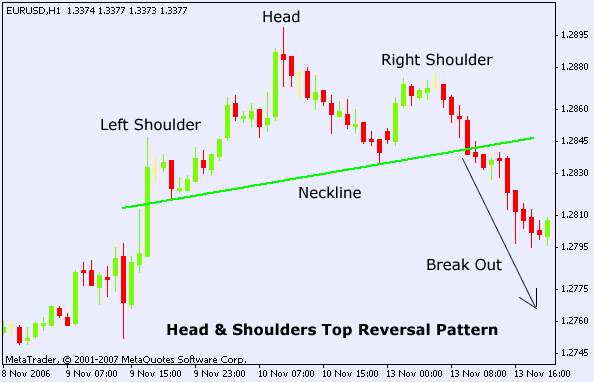
Now, this is a classic chart pattern which often appears the so-called ‘head and shoulders’ pattern .
And no, it’s nothing to do with anti-dandruff shampoo
It gets the name from the fact that with a little imagination it looks like someone’s head and shoulders.
And this ‘head and shoulders’ pattern is a classic reversal indicator, usually seen after an upwards trend.
Basically, it means that the momentum of the price rise is exhausted
As such, it’s a bearish indicator, showing three highs that have all been rejected.
And that can be a good cue to enter a sell order.
So, how do you notice when one is forming?
Well, for a start, you have to look for an uptrend followed by a retracement.
Then, you wait for the uptrend to resume and reach a new high point before retracing again.
When that happens, draw a support line at the lowest retracement price this is the lower red line you can see on my chart above.
This is called the ‘neckline’ and it’s essentially just a support level.
Then, wait and see if the price rises to form another high at the same level as the first ‘shoulder’.
Finally, you simply wait for confirmation that the second ‘shoulder’ high has been rejected.
I usually wait until there’s a bearish red candlestick after that second ‘shoulder’ high but you could also wait for a red candlestick to break the ‘neck’ line.
Last Wednesday, either of these points would have given you an excellent trade entry point to sell EUR/USD.
The stop loss is best placed just above the second ‘shoulder’ high, or possibly just above the ‘head’ high.
But where should your profit target be?
Well, chartists traditionally use the distance from the ‘neck’ line to the ‘head’ line as a potential profit target.
And in this chart, that was around 50 pips which turned out to be a great trade.
Now, I know these patterns take some time to form and they don’t appear every day.
But now you know how to spot it, you could take advantage when it next jumps out at you
And hopefully take a tidy profit as well.


