How to Trade the Double Bottom Pattern
Post on: 21 Май, 2015 No Comment

Stock Trading with Chart Patterns
How to Trade the Double Bottom Pattern
October 22nd, 2011 Steve
The Double Bottom is one of the most frequent and accurate reversal chart patterns. It appears in virtually any stock, commodity and Forex pair and signals the beginnings of uptrends in any timeframe. After reading this article you will be able to identify and trade this chart pattern for immense profits.
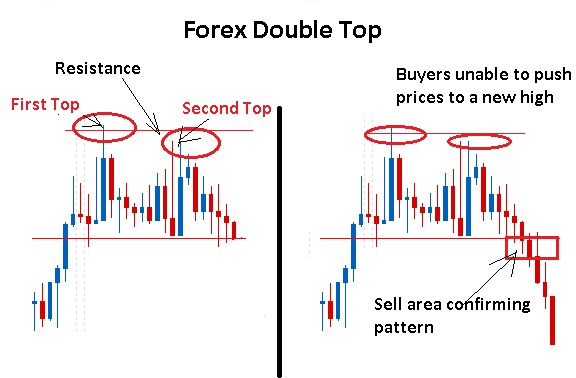
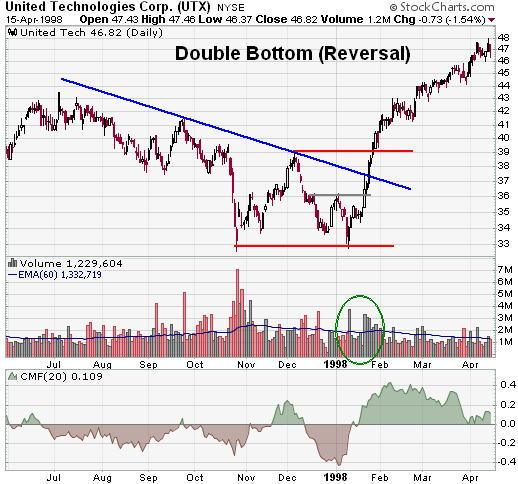
The Double Bottom is a chart formation that signals the end of a bearish trend. It is identical to the Double Top but looks exactly opposite: it consists of two local price bottoms with a local peak that defines the neckline.
The pattern is confirmed when price breaks through the neckline.
The reliability of the Double Bottom is very high, about 74%, which makes it a very consistent pattern.
There are several methods to trade this pattern:
Aggressive Method: aggressive traders would enter a long trade right when the 2nd bottom is beginning to form. The idea of this trading technique is to enter early, capturing all the profits up to the neckline and entering well before the crowd.
If price breaks the neckline we continue to ride the profits with very low risk and very high reward. The disadvantage of this trading technique is that it is less accurate, and not all patterns end up as a double bottom. Price may hit the neckline and bounce back down, creating a triple bottom.
In the aggressive method the stop loss should be right below the lowest of the two bottoms. Note that this trading technique is not recommended for beginners and can result in losses for the unexperienced traders.
Classical Method: The classical method consists of two entry points. First, we enter a long trade when price breaks the neckline upwards. This is a reliable way of trading the Double Bottom pattern that any beginner can and should trade. Stop loss is usually placed below the neckline.

The 2nd method is to enter the trade when price pulls back to the neckline, after breaking it, as if to test its validity.
This is the most reliable way of trading this pattern and it can reach 90% win rate. The disadvantage of that is that price only pulls back in 33% of the patterns, so if you restrict yourself to trading only pullbacks you will miss out on 66% of the breakouts and profits.
This is one of the most accurate trading techniques of this pattern, and we highly recommend entering these trades. They usually offer high rewards with very accurate entry point and low risk.
Profit Target: The profit target is calculated by adding the pattern size (between neckline and the 1st bottom) to the neckline.
In conclusion, this chart pattern is very accurate and well-worth the effort of identifying and trading it.
Like This Article? Share It with your Friends!


