How to Trade Patterns & A Head & Shoulders Pattern
Post on: 16 Март, 2015 No Comment

The price target for the bearish pattern is supposed to be the height of the Head and Shoulder pattern i.e the height from the top of the head to the bottom of the shoulder. This should be the price target of the pattern upon breakdown. Breakdown is when the price starts to fall and that confirms the effect of the pattern and that is called confirmation.
Confirmation is important from the point of view of a trader as he would want to be sure about the validity of the pattern that has formed so as to enable him to commit capital.
For eg. if the top of the head is 150 and the bottom of the shoulder is 110 in a head and shoulders pattern then the price target for the pattern will be 40 below the lowest point of the pattern i.e the trendline. The price target will then be 70 from the lowest point i.e 110-40=70.
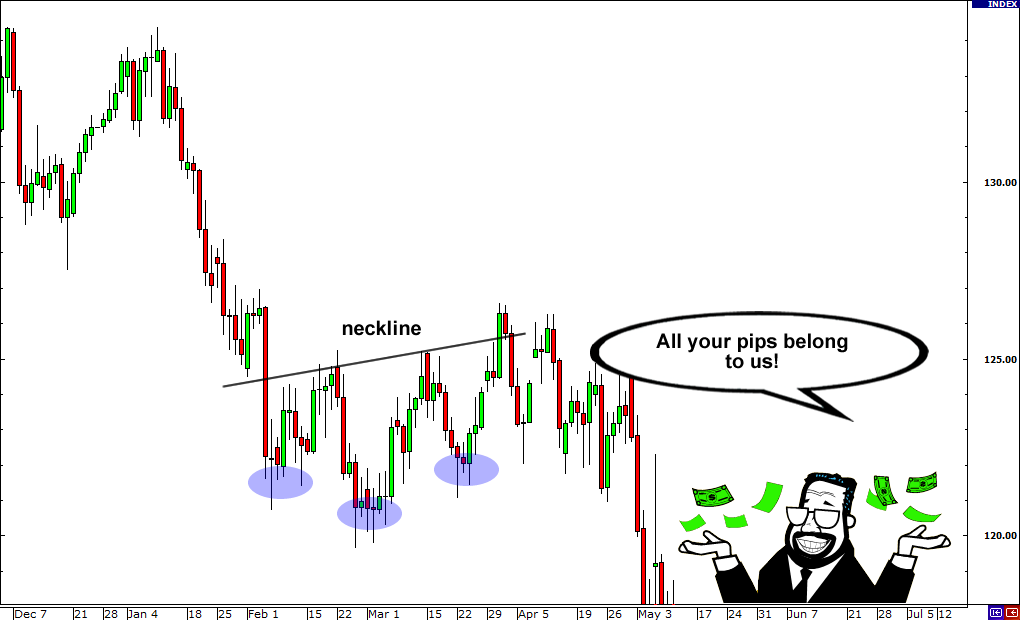
The bottom of the first and the second shoulder can be seen forming a straight line to join and form a trendline. A trendline is a common support and resistance point of prices beyond which the price finds it difficult to penetrate.
When the price penetrates this level it is a good signal of the change in trend and that is where the trader should act. Break of a trendline signifies a change in the psychology of traders and that they are willing to trade a new price after having tested the previous price levels.
For eg. A Head and Shoulders Pattern appeared in the chart of Nifty in April 2011 which lasted for about 7 months after which it broke past it’s neckline. the support price of the pattern. The last price psychologically preventing traders to trade beyond that due to past experience. The volume on the first shoulder was the largest.
The volume on the head was lower than that of the left shoulder and the volume on the right shoulder pattern was lower than the head and the left shoulder. There was a huge spurt in volume when prices broke the neckline and started to fall. When the price broke out from the neckline of the pattern it fell almost the same as the height of the pattern.
When the pattern was in formation we have seen that there was a support in prices at the bottom of the pattern drawn with a trendline on the chart. If we notice when the prices jumped back to consolidate the previous price fall it stopped at the trendline to reverse from there and continue with the fall.
The previous support price became the resistance now. this is a normal phenomenon to occur with support and resistance prices. There was a whipsaw at around June 2011 when the price broke out of the neckline but that was not fall was not sustainable. The price then went back up to the previous price level and moved in a channel for some time.

Whipsaws are fake signals that emerge out of randomness. They give a fake signal of the pattern breaking out from the trendline. Whipsaws generally immediately break out of the trendline in an intraday session and then reverse on the same day. That time for which the price stays in the breakout zone is when traders should maintain calm and understand the pattern has not necessarily broken out as that can even be a false signal.
All the possibilities regarding that price move should be kept open. The price if retracts back to the previous trading level and trades in the previous zone and stays there then know that the breakout was a whipsaw.
One should always wait for a 3% price movement from the breakout point i.e the trendline. This can help validate the breakout from the trendline as it ensures the validity of the price movement. 3% of the height of the pattern here is 12. So, the price should break by 12 from the breakout of the trendline.
This pattern is not the inherent reason for the fall in stock prices but the stalling of the peak and troughs which makes the price change trend. Understanding the reason behind the pattern formations is very crucial so as to profit from them. The primary trend is the upward movement and the pattern temporary halts the price and the corrective effect of the pattern forms the primary trend’s secondary reaction.
One may even come across this pattern at the bottom of the chart after the price destruction has already taken place. Technically this pattern would warrant further price destruction but would it? No. Prices cannot go on falling all the time. This pattern will most probably fail there and the prices may move sideways or reverse. Such a failure of a price pattern is referred to as the pattern getting invalidated.


