How To Define A Trend
Post on: 18 Июль, 2015 No Comment

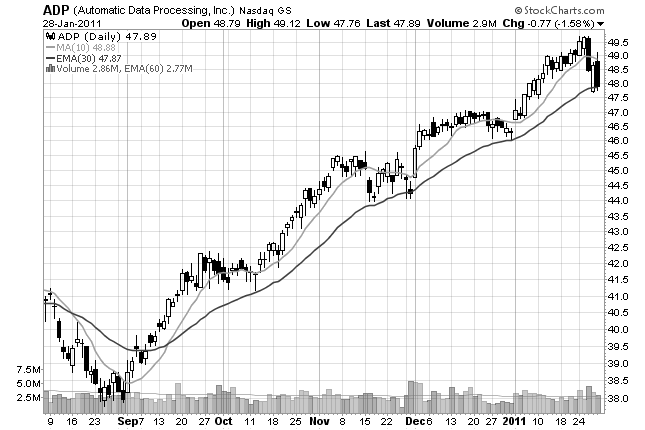
“The trend is your friend” is a quote you will hear often in Forex trading circles. Trading in the direction of strong trends certainly reduces risk and massively increases our profit potential.
But how do we define a trend?
First of all lets look at mechanical ways of defining a trend.
- Average Directional Index. The ADX 14 is a popular indicator used to help determine trend strength. The ADX is based on the moving average of price range expansion over a defined time period which is typically done over 14 bars. The ADX indicator does not show direction; it simply highlights the trend strength whether in an up trend or down trend. It is said that the higher the ADX is, over a static 25 line plotted on the indicator, the stronger the trend is.
- Bollinger bands. A strong trend often crosses the higher or lower Bollinger band. This can show us that price is trending strongly and we can look to buy/sell pullbacks.
- Moving average direction. A simple moving average shows the average trend direction.
- Moving average crosses. I do not look to buy at the moment a moving average cross happens but it can give a heads up as to the overall trend. We can buy on pullbacks etc after the moving average crossover.
One of the best ways of identifying trends, in my opinion, is looking at higher lows or lower highs when analysing our Forex charts . The example I use below is from a Forex chart but this can apply to all financial markets.
In the examples I use below, the process of defining a trend will be explained. I will also show how a trailing stop loss can be moved as price moves higher. These trailing stop losses can be excellent in strong trending Forex markets.
The first chart here shows price moving in an upwards direction. To help clarify this particular example there are no other reference points to the left of the price chart. The blue circle signifies the swing low at this stage.
The next chart below shows price has consolidated at this level and subsequently made a new high. I will now consider the second blue circle as being the active swing low. These higher lows are what defines an uptrend (obviously the process is reversed when we highlight a down trend on our charts).
The process of defining higher lows continues on this next chart. We can use these higher lows to continue trailing the stop loss into bigger profits. The horizontal line on this chart signifies the area that price would need to move below in order to break the trend using this methodology. This may only be a temporary break of trend but it is still one way of analysing trends.
And now we have a move below the previously highlighted active higher low. The arrow signifies the trade exit point on this Forex chart. Our profit stop could now be activated. This would have allowed the market to tell us when to close the trade rather than second guessing ourselves.
The example above shows how a trend can be defined and how we could have trailed a stop loss mechanically below the active higher lows. These semi mechanical exit strategies can stop us making unwise decisions on the spur of the moment and are well worth investigating. Please see our other Forex trading tutorials if you would like to read more about trading Forex using technical analysis.


