How to Day Trade Pivot Points Levels and Reversal Signals
Post on: 20 Январь, 2016 No Comment

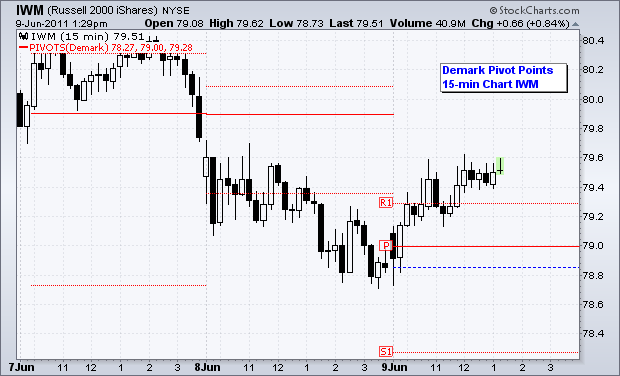
Pivot Points are used by Forex traders to find support and resistance levels based on the previous day’s price action. There are various ways to calculate pivot points, including averaging the open, high, low, and close of the previous day’s chart price.
Forex Traders use a combination of pivot points with moving averages to find trading opportunities in the currency markets.
Pivot points are very useful tools that use the previous bars’ highs, lows and closings to project support and resistance levels for future bars.
Longer term pivot points provide an idea of where key support and resistance levels should be. Place the pivot points on your currency charts and price will bounce off one of these levels. These levels are used by traders to trade market tops, market bottoms or trend reversals. The points are accurate since they provide the high and low of price for a particular day.
- Daily pivots points are calculated from previous day’s high, low, close which ends at 5.00pm EST(2100 GMT)
Below is a calculation of Support and Resistance Levels using this indicator
Pivot Points Indicator — Support and Resistance Levels
How to Interpret and Use Pivot Points in Currency Trading

The pivot point itself is the primary support/resistance level. This means that the largest price movement is expected to occur at this price.
The other support and resistance levels are also important in calculating levels that can generate significant price movements.
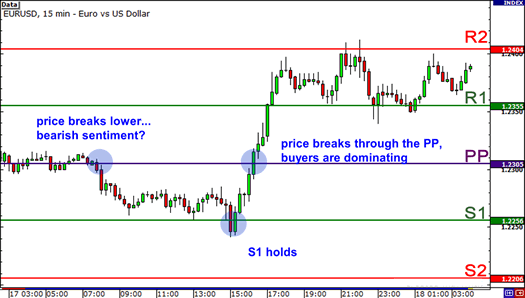
Pivot points can be used in two ways. The first way is for determining overall Forex market trend: if the pivot point price is broken in an upward movement, then the market trend is bullish, and vice versa. However, pivot points are short-term trend indicators, useful for only one day until they need to be recalculated.
The second method is to use these levels price levels to enter and exit the markets. This indicator is a useful tool that can be used to calculate levels that are likely to cause price movement.
These points should be used conjunction with other forms of technical analysis such as Moving averages, MACD and stochastic oscillator.
Pivot point levels can be used in many different ways. Here are a few of the most common methods for utilizing them.
Trend Direction Determined by Pivot Point: Combined with other technical analysis techniques such as overbought/oversold oscillators, volatility measurements, the central pivot point may be useful in determining the general trending direction of the currency exchange market. Trades are only taken in the direction of the Forex trend. Buy trades occur only when the price is above the central point and sell trades occur only when the price is below the central pivot point.
Price Breakouts: When trading price breakouts, a bullish signal occurs when the price breaks up through the central pivot point or one of the resistance levels (typically Resistance 1). A bearish signal occurs when price breaks down through the central pivot point or one of the support levels (typically Support 1).


