How the Harami Candlestick Pattern Can Help You Catch Reversals
Post on: 28 Май, 2015 No Comment

Article Summary: Like most candlestick formation patterns, the Harami tells a story about real time sentiment in the market. After the pattern is composed with the closing of the signal candle, then you can look to the following candle to identify a clear bias and risk points.
Japanese Candlestick charting is older than many markets and due to their tenure, they are quite popular. If youre new to Candlestick charting, it is a n excellent technique that studies the real body or open and close relationship to the shadows or high and low to judge real time sentiment that can be applied on all time frames and markets. We even offer a free online course that you can register for here to understand the main points of trading Forex with this form of visual analysis.
Learn Forex: Japanese Candlestick Analysis
(Courtesy of Fxwords.com)
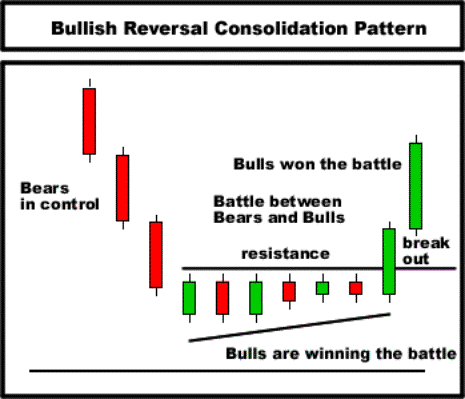
Candlestick trading signals are usually divided into reversal or continuation patterns. Continuation patterns can help you see when the sentiment is likely to keep the prevailing trend going strong. Reversal patterns are very popular for trading and help you recognize when the sentiment that was behind a trend potentially ceases as the pair flips its direction.
When you begin studying candlestick trading to pinpoint market turning points, you are quickly introduced to the Doji Candlestick. The most common principle and first lesson is that when you notice the Doji Candlestick, you should be on guard as it can often show you that a reversal is pending and an opportune time for you to enter. Although Dojis are only composed of one candle that open and closes at near the same level and an upper and lower wick out of the body like a + sign, the next candle tells the story as to the trade preference you should have.
Learn Forex: Dojis and the Following Candle Gives You a Trading Bias
(Created using FXCMs Marketscope 2.0 charts)
Once a Doji forms, its helpful to note other oscillating indicators or moving averages to find if the pair is in an extreme condition or near support because this is when Candlestick formations are most potent. If youre not familiar with indicators that can help you spot extreme conditions or trend support / resistance, here is an introduction to four highly effective indicators that every trader should know. You can use either of those indicators to increase the effectiveness of candlestick entries.
The Powerful Harami Doji
(Created using FXCMs Marketscope 2.0 charts)
The Harami is a powerful Doji pattern because it looks at each candle on either side of the Doji to give you the full picture. The first candle, before the Doji which is highlighted and red above, should be in the direction of the immediate trend and the real body will be larger than the body of the Doji. The third candle, after the Doji will either confirm the reversal if it moves against the first candle or nullify the Harami signal if the immediate trend continues after the Doji.
The Harami is named because it has the appearance of a pregnant woman. The first candle is a large candle continuing the immediate trend and the Doji is a small candle protruding like a pregnant woman. The second candle will tell us if the Doji gives life to a reversal or follows the trend with the starting candle.
The reason for the popularity of the Harami pattern and other candlestick patterns is due to the ability to catch a reversal at the most opportune time with tight risk. This will allow you to have very favorable risk: reward ratios. Because of the favorable risk: reward ratio, one winning trade can keep you ahead even if you have multiple losing trades as long as your trade size is appropriate for your account.
Closing Thoughts
The power of this signal comes in the converging of forces after those in the immediate trend are looking to take profits which leave the trade due for a reversal. The Doji highlights that the preceding force behind the move is no longer piling in and thats why the close is not much different than the opening regardless of the high and low.
Bearish Harami Trade: Short AUDCHF

Stop Exit: Above the Starting Candle At 0.9630
Trade Limit: In the Direction of the Trend At 0.9375
Happy Trading!
—Written by Tyler Yell, Trading Instructor
To contact Tyler, email tyell@fxcm.com.
To be added to Tylers e-mail distribution list, please click here.
Take this free 20 minute Price Action — Candlesticks course presented by DailyFX Education. In the course, you will learn about the basics of price action and how to use the clues the market is providing to place trades.
Register HERE to start your FOREX learning now!
DailyFX provides forex news and technical analysis on the trends that influence the global currency markets.
Learn forex trading with a free practice account and trading charts from FXCM.


