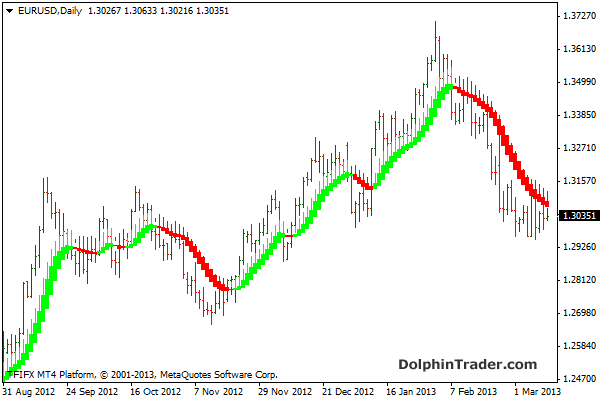
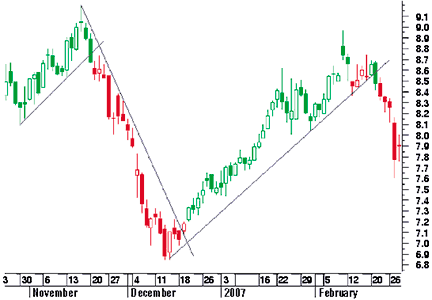
HeikinAshi Candlestick chart
Post on: 13 Май, 2015 No Comment

Daily Recap – Heikin-Ashi Candlestick Chart
Chart patterns are one of the most relied upon ways to anticipate a market move, whether it’s in currency, commodity, equity or bond markets. Most traders use the Japanese candlestick charts because it offers traders the vision they are looking for, but today we want to focus on the Heikin-Ashi candlestick chart.
Most traders are familiar with traditional Japanese candlesticks. They are the green and red, or black and white bars you normally see on the default setting of a chart, and they show visually the open, high, low, and closing prices for any given period of time. If you aren’t familiar with candlesticks, for more information check out our candlestick education section .
Heikin-Ashi candle charts are a way to view the market with less volatility than whats really happening and this is because of the way it is formulated. if we look at the formulas used to create the Heikin-Ashi charts we will see that it’s totally different than the standard candlestick charts.
Close price = (Open+High+Low+Close)/4
Open price = (Open(Previous Bar) + Close(Previous Bar))/2
High price = Max(High, Open, Close)

Low price = Min(Low, Open, Close)
Based on the above formula we can expect to see a candle stick where volatility of price action has less of an effect. The same chart patterns that traders look for and try to apply on the standard Japanese candlestick charts also apply to the Heikin-Ashi chart. If we look at the attached charts and compare the same candle on both types we can see that the Heikin-Ashi offers a view that absorbs part of the excess volatility leaving the pattern more clear to the viewer.
We have attached an example of a head and shoulder pattern that has formed on the NZD/USD daily chart. We have been looking at this pattern formation for a while. Todays candle changed the pattern slightly on the traditional Japanese candlestick chart, however on the Heikin-Ashi chart the pattern still looks the same. A good example of using an alternative chart type to cancel out some of the noise in the market.
The charts and examples found on this website are educational examples and are not intended to be representations of profits or losses that can be achieved through forex trading. When reviewing any such examples, please keep in mind that past results are not necessarily indicative of future results.


