Harmonic Patterns For Forex Trading
Post on: 12 Май, 2015 No Comment

Harmonic price pattern traders use Fibonacci numbers and geometry to define potential pivot areas. The harmonic patterns allow traders to identify a logical area to put the stop-loss and therefore define the potential risk/reward ratio before entering a position. In this article we will look at some harmonic price pattern examples and how they are utilised to trade on the Forex market.
How can harmonic patterns be used to trade Forex?
Harmonic trading combines patterns and math into a trading method that is precise and based on the premise that patterns repeat themselves and can provide an edge. The respective patterns have clearly defined ratios and it is down to the individual trader to do the required analysis and enter trades with sensible money management. A plan with regards to taking profits and reducing risk is also vital.
Let’s take a look at the “Gartley pattern ”.
The Gartley was first published by H.M. Gartley in the “Profits in the Stock Market” book.
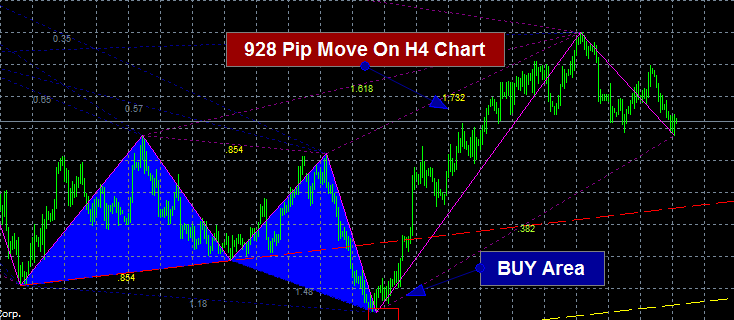
The bullish Gartley pattern, as seen below, is often seen as an indication that the corrective waves are finishing and a new move higher will begin at D which is a 0.786 correction of XA and a 1.27 or 1.618 Fibonacci extension of BC.
The Gartley’s base structure is an AB=CD retrace into the prior longer move.
Traders using this pattern will be looking to go long at point D.
I personally like to see point D have confluence (see my support and resistance post for further details).
So to summarize The Gartley pattern enables traders to enter a with the trend trade and clearly define the risk associated with a trade.
Bullish Gartley Pattern
A clear AB=CD pattern can be seen on the chart below with a confluence of Fibonacci extension and retrace levels.
Bullish Gartley AB=CD
Always do your top down analysis. These patterns are often fractal and exist within larger patterns. Try to look at the big picture, and pay special attention to the higher time frames, to make sure a larger pattern does not conflict with the one you have identified.
As mentioned many times before on the blog. I look for confluence when searching for trade ideas and very rarely enter on one signal alone. Patterns like the Gartley represent the confluence of Fibonacci retracement and extension levels at point D. This points towards the potential for a higher probability that market could see a subsequent reversal. I still like to see additional confluence. Its also worth pointing out that you should never try to catch a falling knife, as the saying goes, when trading the markets. Try to find harmonic price patterns aligned with the prevailing market sentiment. Further to this, if you add a high quality price action signal to these setups I become even more interested. It’s about stacking the odds in my favor.
Are these harmonic patterns new to you? The Forex Tester platform is excellent for testing new trading ideas.
If you want to learn how to trade these patterns it is essential that you prove to yourself that you have an edge before trading them live.


