FX Trading Using Median Line Analysis
Post on: 7 Июнь, 2015 No Comment

Each of us approaches trading a little differently; show a chart to two traders and you will get contrasting views of what the chart is doing. Why? Interpreting a chart and translating what you observe into actionable trades is shaped by our beliefs and experiences. Since each of us is unique, we need a common ground of reference to discuss trading signals. This post will serve in building a sturdy foundation of common terms and definitions so that we can communicate clearly to reach our goal: a disciplined, winning trader.
What is Median Line Analysis (MLA)? In observing historical price patterns, we can find the slope or direction of activity. If the market is going up as evidenced by an up sloping line, it is likely that prices will continue to trend up. For the market to reverse and turn down, or even become “trendless” and move sideways, something has to occur to move prices against the current trend. There are many different strategies that traders use to trade trends: channel breakouts, n-period new high/low, Elliot wave, etc. Each approach to trading requires intimate understanding for the trader to be profitable.
Once we first determine market direction or path of price, we need confirmation before entering a trade; the more observations supporting our analysis, the greater conviction that we are correct. An example of this would be a downtrend line that has lower highs and lower lows with pullbacks defining the trendline. The more touches of the line, the increased probability and lower risk of selling a pullback with a tight stop at the previous pullback.
Let’s say we are Forex traders. Look at the EUR/GBP pair from April 2011 to July 2012:
Without much argument, this daily chart shows a downtrend.
At first glance, the general slope of the line is downward, indicating prices are dropping. A trader who has a long time horizon using this daily chart had several opportunities to trade the pair short. Notice in the next figure the lower highs and lower lows the currency pair is making.
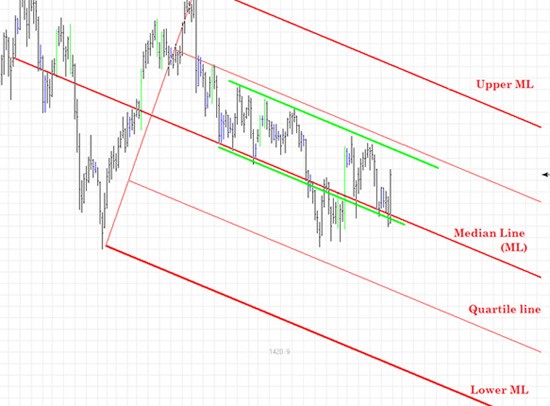
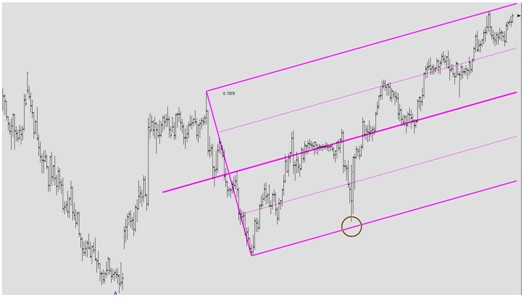
After establishing the initial sloping median line, the next step is to find an upper and lower boundary that prices will tend fall between. We do this by finding a swing high and swing low. These two points anchor a pair of parallel lines to the median line. Many charting programs use a tool called a pitchfork or “Andrews Pitchfork” to create the desired fork of lines.
We have drawn in the basic fork for the EUR/GBP pair. Let’s cover some terms.

- Median Line (ML) – the main reference line that we drew that indicates the path of price for the timeframe we are interested generating trading signals, in this example the Daily price chart. Price tends to trade around the median line.
- Upper Parallel Line (UP) – a line originating from a swing high that is parallel to the ML
- Lower Parallel Line (LP) – a line originating from a swing low that is parallel to the ML
We will cover trades that could have been taken using Median Line Analysis in the next post. Till then.


