Free Forex Trading Strategies Directional Movement Indicator
Post on: 27 Июль, 2015 No Comment

Free Forex Trading Strategy from eSignal
What is it?
The Directional Movement Indicator, or DMI, is a popular technical indicator used to determine whether or not a currency pair is trending.
DMI has three significant lines.
- Average Directional Line (ADX)
- Positive Directional Index (+DI): Measures an upward movement in price
- Negative Directional Index (-DI): Measures a downward movement in price

Each line is plotted on top of another and ranges from 0 to 100. The mathematical computations for the level of these lines are beyond the scope of this report but are fully explained in books that define and describe technical indicators in greater detail. The default time parameter used is 14 for both the DMI and ADX period although highly risk-averse traders occasionally use the 30-period.
How is it used?
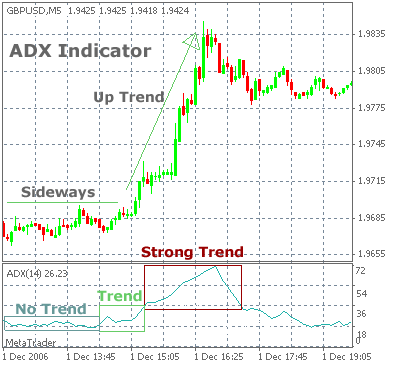
When the ADX line is at the high end of the range, this indicates that the current trend is strong. A reading under 25 indicates a non-trending market (and, therefore, range trading strategies should be looked at) while a reading above 40 indicates a strong trending market (and, therefore, trend trading strategies should be used).
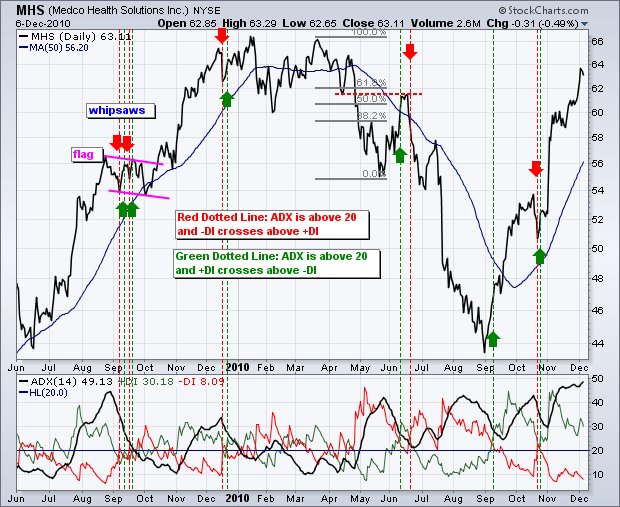
Trading signals are given when the +DI crosses the -DI line. Wilder, the creator of the DMI, suggests buying when the +DI rises above the -DI and selling when the +DI falls below the -DI. You can actually consider the DMI a trading system in itself because you buy or sell on crossovers only when the current trend is strong.
DMI is similar to most oscillators in that traders may also look for divergence. A divergence occurs when the price makes new highs, but the indicator (in this case, you are looking at the ADX line) does not. This indicates a possible reversal of the current trend. However, many traders will still consider the trend strong above the 30-level, even with divergence.
When using the crossover signals, a trader also looks at the extreme point rule. The rule requires that you note the extreme points on the day of the crossover (never enter a trade on the day of the crossover). With a bullish signal, the extreme point is the high of the day, whereas with a bearish signal, it is the low of the day. The rule is to prevent you from whipsaws and chasing the markets because you may receive many false signals.


