Forex Trend Indicator_1
Post on: 30 Апрель, 2015 No Comment

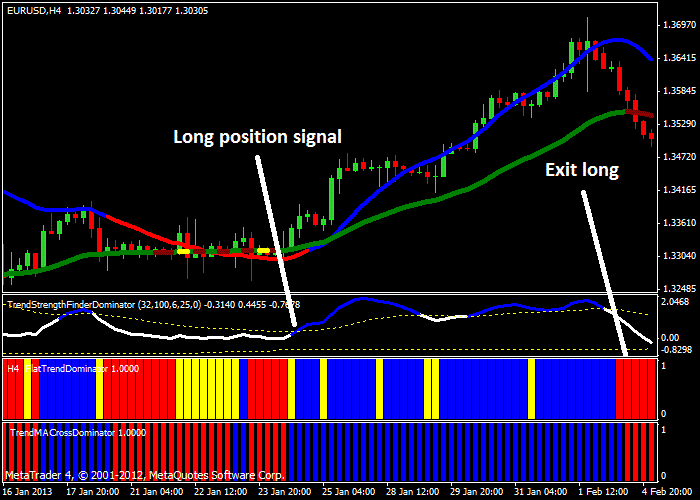
Currency pairs trend but what is the best Forex indicator to spot these trends and lock into them for profit? Let’s take a look at how to spot FX trends and the best indicators to use.
Trend Lines
First, one of the best indicators is to simply look at a trend line on any Forex chart. By drawing trend lines, you can see the direction of the trend. What you are seeing is the reality of a trend on a Forex chart and not just an opinion. While under used, the trend line is still one of the most powerful of all Forex trend indicators.
We will look at some of the most popular technical analysis indicators in a moment but there are many traders who use NO indicators at all and just use price action strategies and they can be every effective. Our own view is to use both trend lines and a few indicators, to filter our trades and some of the ones we use are outlined below.
Moving Averages
Another powerful way of spotting trends is to use simple moving averages. While prices spike short term, they will normally return to an average price longer term.
A moving average as a trend indicator, will help you filter out the short term price spikes up or down and allow you to see the prevailing trend. Buying back to a moving average in a bull trend or selling back to a moving average in a bear trend can be a very effective way of getting in on the trend with the best risk to reward — So what are the best moving averages for trend following?
For long term trends, we like the 40 or 200 day averages which we find very effective. A word of caution though, moving averages are not very effective in short term time frames – the longer the moving average the more effective it is in determining the long term trend. We like to look at both moving averages on a weekly and daily chart to get the big picture and while moving averages are not considered glamorous or trendy, there very effective.
MACD
MACD is an effective trend following indicator you can use it as a trend following indicator, as well as an indicator which can warn of a potential reversal. For example, you can tell by the direction of the histogram up or down where the trend is and a move up or down in the histogram can tell you when a trend is gaining or losing momentum.
The MACD uses moving averages but they are turned into a momentum indicator by subtracting the longer moving average from the shorter term moving average. This results in a line which oscillates above and below zero, with no upward or downward limits and this can also help you determine the trend and also, look for potential signs of a reversal when the trigger lines cross in overbought or oversold territory.
ADX Average Directional Movement
The ADX is a defined as a momentum indicator and was designed by Welles Wilder who had one aim with the ADX — To measure the strength of a trend. The indicator gives you an idea of if the market is trending, or is trading sideways in a a trading range.
The old technical analysis saying is — “A trend in motion is more likely to continue, than reverse.” is true — but you need to know if the market is still likely to trend and just as important — how strong the trend is. The Average Directional Movement indicator will help you do this and is an indicator all Forex traders should consider incorporating in their trading strategy.
Forex Trend Indicators Using them For Profit
The above are just a few examples, of popular trend indicators and of course there are many more. If you use them in your trading system, combined with trend lines to help you establish the trend, along with simple trend lines on a Forex chart, you will gain better market timing, with your trading signals. This will enable you to make more money from the trend itself and even, be able to spot when a trend might turn and its time to take profits.
If you use the above trend indicators in your FX trading strategy, you will soon find they will help you make bigger trading profits.


