Forex Trading System X
Post on: 20 Апрель, 2015 No Comment

Copy the Forex Trading System X files and run MetaTrader 4, open EUR/USD, GBP/USD, USD/CHF or any other major pair that you want to trade. Set chart time frame to 30 mins and apply the template:
Forex Trading System X EMA, MACD MFT, BBands and RSI based Forex Strategy looks complex when you see plenty of indicators on your chart but in fact it is very simple to follow. You can use 25 pips stop-loss and 25 pips take profit orders . When you are in a profitable trade, you may choose partial closing and let the rest run with a 15 pip trailing stop.
Buy when all indicators turn to blue and price candle is green color.
Sell when all indicators turn to red and price candle is purple color.
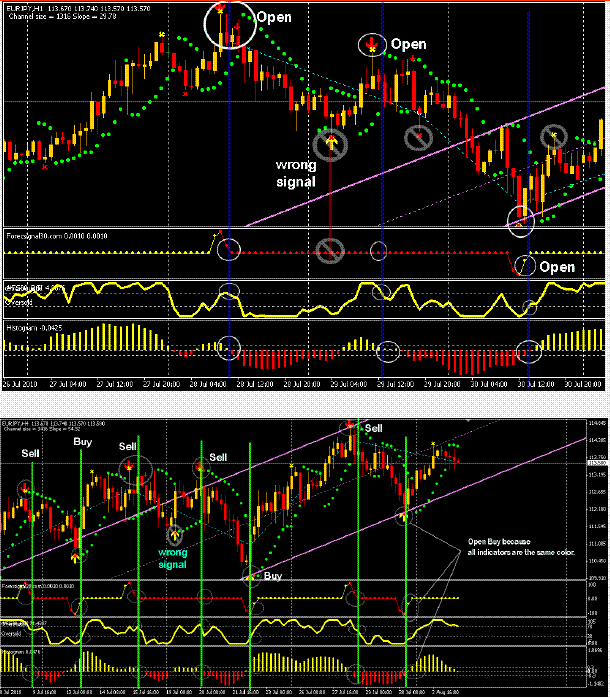
Let me show you this chart so that you can understand what I mean:
I told you it was very simple, it really is. There are also other useful things on the charts so use them as well. You can also set your T/P and S/L targets according to support and resistance levels. You can check the market hours, very handy template.
Download Forex Trading System X EMA, MACD MFT, BBands and RSI based Forex Strategy Indicators and Templates
Download Include:
- trading-system-x.tpl
- Bar Trend.ex4
- BBands_Stop_v1_BAR.ex4
- Clock v1_2.ex4
- DailyData.ex4
- EJ_CandleTime.ex4
- EMA Crossover Signal.ex4
- FerruFx_Multi_info+_light_chart_v1.1.ex4
- FLATTRAND_w_MACD_mtf.ex4
- RSI div.ex4
Comments
3A%2F%2F0.gravatar.com%2Favatar%2Fad516503a11cd5ca435acc9bb6523536%3Fs%3D48&r=G /% Cesar Ruiz says
As always, excellent material. Useful tolos. Thanks a lot
3A%2F%2F1.gravatar.com%2Favatar%2Fad516503a11cd5ca435acc9bb6523536%3Fs%3D48&r=G /% Nathan says
Thank you Cesar! Were making efforts to make quality and useful content for all of you guys interested in Forex. If you have a wish to see something let us know and well see to it.
3A%2F%2F0.gravatar.com%2Favatar%2Fad516503a11cd5ca435acc9bb6523536%3Fs%3D48&r=G /% raj akhil says
brilliant toolworks well in 1 hr time frame. can u elaborate on the exit strategy fr this indicator
3A%2F%2F0.gravatar.com%2Favatar%2Fad516503a11cd5ca435acc9bb6523536%3Fs%3D48&r=G /% Dave says
Its really tricky part of any strategy. You need to overview daily high & low of current and few last days in market. So you can get idea what you can expect from market, if you are good in reading news that is one more think which can help you.
Lets say you are check few daily high/lows and you expect 100 pips move, you can exit/take profit at 60-70% of your expectation. You can also use 2-3 take profit levels so you can protect your profit and so on.
I hope you can benefit from this tips.
Regards!
3A%2F%2F1.gravatar.com%2Favatar%2Fad516503a11cd5ca435acc9bb6523536%3Fs%3D48&r=G /% ace binary says
is there an alert or signal for the arrows on the rsi divergence it would really help more
3A%2F%2F1.gravatar.com%2Favatar%2Fad516503a11cd5ca435acc9bb6523536%3Fs%3D48&r=G /% Leonidas Reynolds says
struggling to replicate the example chartwhen all files are loaded I am not seeing market time data yo the lower right hand side of the screen and additionally this is returning a looped error where I am seeing a pop-up saying cannot convert htm can you advise?
3A%2F%2F1.gravatar.com%2Favatar%2Fad516503a11cd5ca435acc9bb6523536%3Fs%3D48&r=G /% mike mak says


