Forex Trading Strategies Divergence Trading Strategy
Post on: 8 Август, 2015 No Comment

In trending markets the Relative Strength Index indicator (RSI) mostly mimics the movement of the price action. In other words, when the price action makes higher highs on the chart, the RSI should make higher highs too.
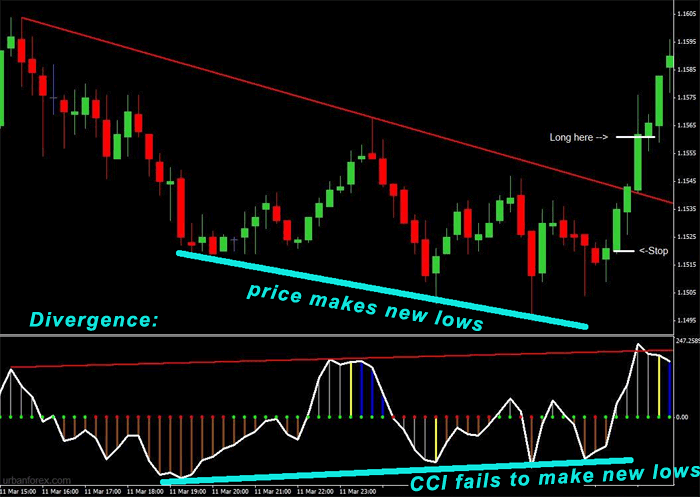
But there are times when the RSI indicator does not mimic the price action (it creates a divergence) and when this occurs, its usually a sign that the price action will soon follow in the direction of the RSI divergence. Thats what the divergence trading strategy is all about; finding divergences and taking a position based on those divergences.
There are 3 different types of divergences that occur on between price action and the RSI indicator:
Positive Divergence Trading
A positive divergence is when the price action makes a lower high but the RSI makes a higher high. This is usually an indication that the price action will follow in the direction of the positive divergence (i.e. up) and means that you could profit from a long position based on this positive trading divergence.
Negative Divergence Trading
A negative divergence is when the price action makes a higher high but the RSI makes a lower high. This is usually an indication that the price action will follow in the direction of the negative divergence (i.e. down) and means that you could profit from a short position based on this negative divergence.
Flat Divergence Trading
A flat divergence is when the price action makes a higher high while the RSI makes a double top, or when the price action makes a lower low but the RSI makes a double bottom. Either way, it means that the RSI indicator is not confirming the price action and it means that its highly likely a correction will occur.
Lets take a look at this monthly chart of Eur/Jpy for some good examples of trade-able divergences (click for a larger image):
The image above is a monthly chart going back as far as 1985. Ive market negative divergences and flat divergences in blue and positive divergences in red.
Looking on the chart youll probably be wondering how you can make money with divergence trading if there have only been 5 divergence setups over a period of 25 years?
Keep in mind that this is a monthly chart, so any positions you take based on a monthly chart will take months or years to rise out in the expectation that you have of the setup. If you move down to weekly or daily charts, youll find many more trade-able divergences that you can profit from.
It all comes down to your trading strategy and the level with which you want to be involved in the markets. If you want to have a very relaxed approach to trading and dont care about instant results (i.e. you have all the time in the world), then it would probably suit you to make trades based on weekly or monthly charts. This means youd only trade a few times per year and have no worries of needing to check the market every day or sitting glued to your screen all day.
Personally I like to find divergences on a daily chart for my divergence trading strategy. This still means that divergence setups will only occur every few weeks, but Ive found daily time-frames to be more reliable than the shorter 4-hourly or hourly divergence setups.
On this daily chart of Eur/Usd above (click for a larger image), you can see how over a period of 18 months there were also 5 trade-able divergence setups.
If you had used divergence trading on a daily time-frame on the Eur/Usd chart over the past 18 months you could have literally made thousands of pips profit while not having to stare at your screen all day. Once you take your position and set your stop loss, its merely a matter of checking the markets once a day and letting your position ride until the profit is enough.
When To Take Profits From Divergence Trading Setups
Since I havent given you guidelines for stop-losses and profit-taking points of your divergence trading, you may still be wondering how exactly to go about using the divergence trading strategy.
Divergence Trading Step 1
Find a divergence between the price action and the RSI of any currency pair on a time-frame of your choice (I suggest 4-hourly or daily).
Divergence Trading Step 2
When you think the price action has made a final top or bottom (depending on the divergence you found on the chart), you simply take a position at market.
Just like with any trade, strict money management needs to guide the position youre taking with divergence trading. If your rule is that you only risk 5% of your account on a given trade, you need to work out at whatposition your stop-loss needs to be from your entry point.This depends on your account size and trade size. A bigger trade size will make your stop loss level closer but your profit potential bigger. A smaller trade size will allow you to have a further stop loss level which can be useful to not get stopped out with normal market fluctuations.
In other words,for divergence trading you need to find a balance between position sizing and stop-loss levels, so that you have enough leniency for market fluctuations and yet still enough position size to make a decent profit.
For positions taken based on a daily time-frame, Id recommend a stop-loss level 200 pips from your entry point. 100 Pips is still acceptable bus doesnt give much room for final capitulations or exhaustions or spikes.
As a full-time forex trader, divergence trading should be one of many tools in your trading arsenal. However, if you only trade the forex markets part time its entirely possible to make a lot of money using only the divergence trading strategy.


