Forex Technical Analysis Trading Tools
Post on: 11 Июнь, 2015 No Comment

Updated: April 12, 2013 at 10:10 AM
A particularly popular method of trading forex involves using technical analysis to generate buy and sell signals.
Forex traders using technical analysis often use specific recognizable price patterns recorded on charts or indicators calculated from market observables like price action to provide them with a sense of the market’s future direction.
Some of the most commonly-used technical trading methods are discussed further in the sections below.
Support and Resistance Levels
As anyone in the business will tell you buy low and sell high is all you have to do to be successful in trading. Of course, it is easier said than done.
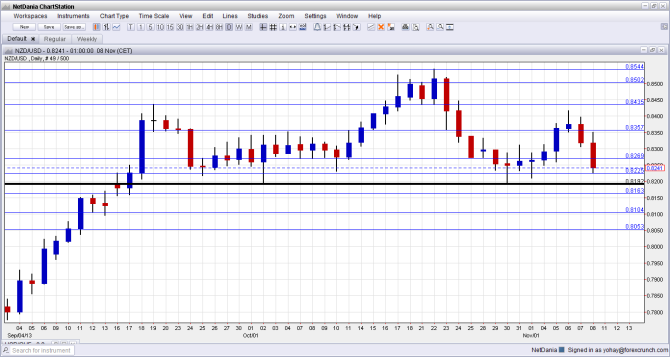
Nevertheless, by carefully reviewing price charts, a technical analyst can determine at what levels supply has been exhausted and higher prices are needed to stimulate more supply; and where demand has been satiated, and prices need to be reduced in order to create more demand.
These levels are usually called support and resistance levels and are commonly used in the interpretation of price charts.
Chart Patterns
Many technical forex traders regularly peruse charts of the exchange rate for a particular currency pair plotted over time. They look for classic chart patterns in the process of forming.
These patterns might include triangles, double tops and bottoms, head and shoulder tops and bottoms, flags, pennants and wedges. They might also look for trading ranges, as well as trends and channels on the charts.
Most of these classic chart patterns have predictive value once the pattern breaks a certain well-defined level and then sets up a so-called measured move as a target for subsequent price action.
Counting Waves
Elliot Wave Theory is based on observing repeating wave patterns and also uses ratios from the Fibonacci number sequence to determine retracement and wave projection objectives. In general, the theory postulates a five-wave trending market, followed by a three wave corrective move.
Moving Averages
Moving averages are computed by taking an average of prices observed within a particular time frame as it evolves over a range of time periods. They can be simple, exponential or weighted, where more weight will generally be given to more recent price data.

The convergence and divergences of moving averages generates trading signals and this can be measured more accurately using the Moving Average Convergence Divergence (MACD) indicator. Read more on the MACD indicator here.
Oscillators
These technical indicators usually give the trader an indication of price momentum and/or an oversold or overbought condition in the market, and they are generally measured on a scale of 0 to 100%.
The Stochastics Oscillator is a popular example of a momentum indicator. Its basic premise is that in an uptrend, prices tend to close in the higher part of the day’s range to signal upward momentum. In a downtrend, closing prices tend to close in the lower part of the day’s range, thereby indicating downward momentum.
The Relative Strength Index (RSI)
The RSI is a useful indicator of overbought or oversold market conditions, and like all banded oscillators fluctuates between the values of 0 and 100.
If the RSI is showing a number higher than 70, then the market is considered overbought, but if the number is below 30, then the market is though to be oversold.
Risk Statement: Trading Foreign Exchange on margin carries a high level of risk and may not be suitable for all investors. The possibility exists that you could lose more than your initial deposit. The high degree of leverage can work against you as well as for you.


