Forex Technical Analysis Basics
Post on: 1 Июль, 2015 No Comment

Share this forex article:
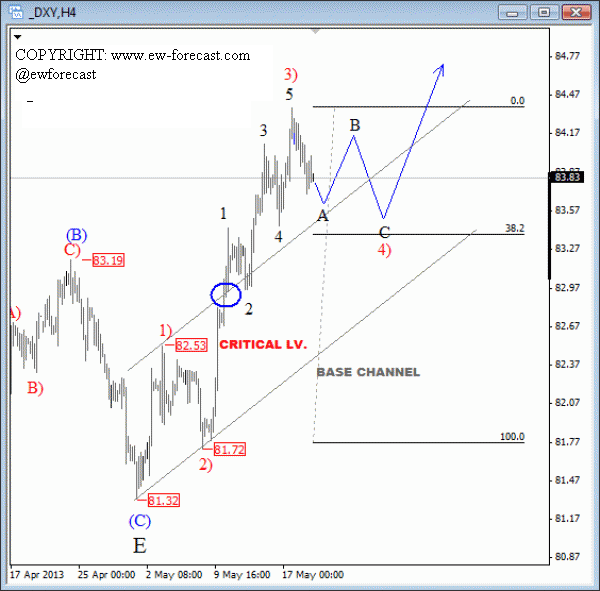
Forex technical analysis can be described as a special set of methods that are used in order to forecast currency price movements thanks to numerical computations. A forex trader needs to aim to use technical analysis in order to increase profits possibility, especially when faced with a highly volatile market. You will need to use good platforms in order to gain access to high quality technical analysis.
In this video below you can see in 16 minutes some basic informations about technical analysis :
How does Forex Technical Analysis work?
Forex technical analysis will use current and past currency behaviors so that it can predict trends. We can thus define it as being a science that identifies behaviors and takes advantage of momentums. Just like weather predictions, in most cases technical analysis will be correct. The problem is that many will over-analyze. We see millions of online traders that read the exact same charts. This means that you need to be cautious whenever reading the data in order to not make a mistake.
Overview of Forex Technical Analysis Tools
Charts – In most situations technical analysts will use charts in order to measure the movements of prices. Most charts will appear under the form of bars, lines, candlesticks, renko and point and figure. Every single chart will offer a unique price interpretation. This means that it is crucial to follow the ones that will better suit your style so that you can easily notice price movements.
Resistance and Support – Resistance and support lines stand out as a concept that an expert trader always appreciates. Support levels are price levels where prices will find support while going down. Resistance levels are points where sellers will start controlling price in order to prevent further rising. Resistance and support levels can be identified if you carefully analyze the charts offered. Resistance and support levels are the events that are easiest to notice in any price chart.

Divergence and Convergence – Divergence happens when indicators move away while convergence shows them coming closer together.
Levels – Such levels will denote historic lows and highs on price charts. They are extremely helpful when indicating future action of prices. As soon as new historic lows or highs are achieved there will be some time before benchmarks will be improved on.
There are also other tools that will aid you in using technical analysis in forex trading. As an investor you need to be aware of as many as possible and know how to use them properly.
%img src=http://media.avapartner.com/banners/p491832567.gif?tag=2301&tag2=


