Forex Strategy Trend Lines
Post on: 20 Июль, 2015 No Comment

Forex Strategy Trend Lines
Forex Strategy Trend Lines — another multi-currency trading strategy based on graphical representations, in which the indicator forex, reflecting the market situation, is the price itself, this vehicle looks like something then the strategy 3 Touch and for trade, we need only one trend line and some rules strategies that will enable us to make a profit!
And so we will trade for 2 time-frames — H1 and M5 (or rather the beginning to find conditions on the H1, and then proceed to trade M5).
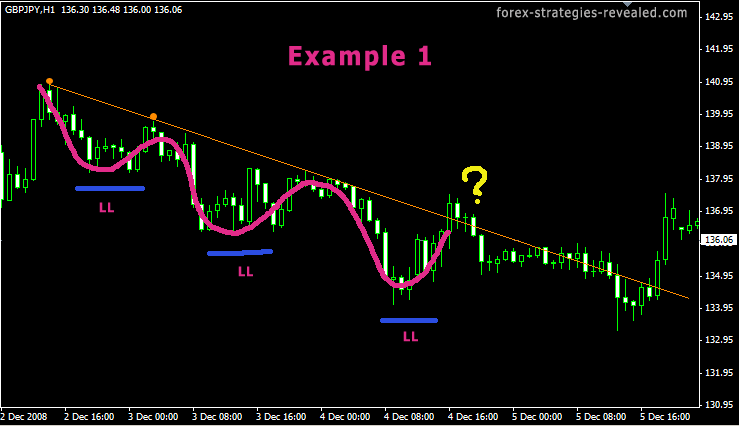
1) The time frame H1 define two consecutive points, through which draw a trend line and label them as 0? and 1. an example look at the picture:
2) Then, after determining the points 0 and 1, go to the range of M5.
following constructions will be analyzed in the figure below (to enlarge — click on it — will open in new window):
3) After the formation of point 1, we expect rebound from the trend line and the formation of the Maximum. which will henceforth denote the point 2.
4) Once the price started to turn again to the 0-1 trend line, we expect the formation of point 3 — the first point at which we’ll make a deal for the purchase of a pending order BuyLimit, you want to install approximately 5-8 points above the trend line (for purchase transactions).
5) Stop-Loss is placed under the point 1.
6) take profit set at point 2. You may want to close only part of the deal, when you reach the level of point 2 and the balance transferred to the position of a trailing stop.
But it also should take into account one very important condition in the forex strategy.
deal for buying and selling is only if you intend to distance from point 1 to point 3 (1-3) are 2-3 times smaller than the distance from point 2 to point 3! Ie alleged stop-loss is 2-3 times less than the intended profit target!
If this condition is not met — the deal is not! See example below:

7) After breaking point 2 — the price usually moves up to its maximum, which we denote the point 4, and then falls again to the trend line, an example look at the picture (for larger — click on it — will open in new window):
8) In the approach to price trend line, again, we check the ratio alleged stop-loss and take profit. If distance is less than 3.5 to 2-3 times than the range 4-5 — set aside a warrant to purchase — Buy Limit.
9) Stop-loss is placed below the point 3.
10) take profit set at point 4.
If desired, a scheme for deferred purchase orders can be and to continue further, but this is at your discretion and subject to the necessary conditions at a ratio of stop-loss — profit target.
For transactions on sale — check the conditions!


