Forex Price Charts Basics
Post on: 11 Июнь, 2015 No Comment

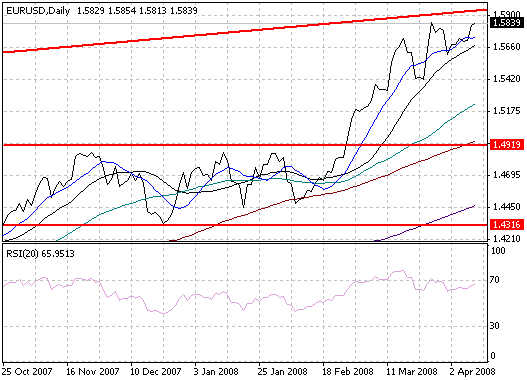
Where would a forex trader be without price charts? These are the primary tools for conducting all kinds of market analysis on the action of currency pairs.
A trader uses them to view currency rate historical data and to make informed forecasts on future currency price movements. A commonly asked question is which specific forex charting software is the best.
The answer unfortunately is not so cut and dried. This is because each individual forex trader has his/her own unique trading style and thus, needs unique tools to identify the most beneficial trade opportunities.
Benefits of Forex Price Charts
There are many different types of forex price charts available to cater for all kinds of trading styles. Some of the benefits a trader can hope to derive from these charts include:
- They help in the realistic and real time visualization of the global foreign currency exchange market environment.
- They help in the identification of market patterns and behaviors.
- They are the primary tools for conducting both technical and fundamental forex market analysis.
The forex technical analyst uses forex price charts by focusing on the actual event occurrence and the known patterns of price movement.
On the other hand, the fundamental forex market analyst focuses on analyzing price trends visible on the price charts and studying their correlation to macro events. These events include economic policy changes and political events.
How to Use Forex Price Charts
In order to benefit from the use of forex price charts, there are some essential points any trader or market analyst should focus on.
1) For accurate analysis, one needs to have a good understanding of support and resistance price levels.
2) A forex trader needs to understand the kinds of market indicators that need to be aligned to signify whether a particular price level will hold or break.
If a forex trader learns how to use these two points to full advantage, then s/he can easily formulate a winning forex trading strategy within a relatively short period of time.
For even better and faster results, it is advisable for a trader to join a professional service that provides real time online forex charts including indicators and market analysis.
Types of Forex Charts
The most common forex charts used today include:
1. Line Charts
These are the most basic and simplest charts. They are based on market closing exchange rates for each trade period and offer the best method to easily chart currency price resistance and support levels.
2. Point and Figure Charts
Unlike most other chart types, these types of price charts do not provide linear representations of time. However, like most they are based on currency prices.
3. Bar Charts
These are detailed charts which provide at least 3 different rates at each instant. These are the price highs, the price lows, and the closing rates. Some bar charts additionally include the opening rates.
4. Candlestick Charts
These are the most popular price charts used in the forex market. They provide a comprehensively detailed snapshot of the market in an easy to read way. Candlesticks show the opening, closing, high, and low exchange rates for each point in time.
Dark candles represent a decline while transparent candles represent an increase. The length of the candle wicks and tails and the length of the body shows the full price range for each particular time period.
By Alfrick Opidi


