Forex Pivot Points
Post on: 19 Декабрь, 2015 No Comment

Immensely powerful, neglected by the mass of traders, embraced by a savvy few as an extra edge in their forex trading…
Open outcry on the pre-digital trading floor of the New York Stock Exchange
Pivots originated in the very early days of the grain trading pits, way before computers or electronic devices existed.
The pit traders used the previous sessions trading range prices to draw up a series of levels which they used as reference points for the current days trading.
This crude attempt to predict the current sessions price action around certain price levels proved surprisingly successful. and was soon picked up by other traders. Thereafter, the idea of using pivot points gained popular acceptance.
N.B. it took me almost 2 years to refine what I believe to be the best forex pivots indicator for MetaTrader. Its free to all AuthenticFX members. Click the following link to get access to the members area and the AuthenticFX Forex Pivots Indicator:
This in turn made the actual pivot levels even more powerful. as many more traders were now watching key levels, ready to place orders when priceapproached them.
This same system of plotting a daily central price level and other price levels stepping off from that, forms the basis of forex pivot trading. Forex pivots are a set of price levels plotted for the current day based on the previous days high, low and closing price.
(N.B. The term itself is something of a misnomer as there is only one pivot point: the central pivot. All the other levels are actually offsets from this central pivot.)
The calculation to get the central pivot is to add the previous high, low and close together and divide by three:
Central Pivot = (HIGH+LOW+CLOSE) / 3
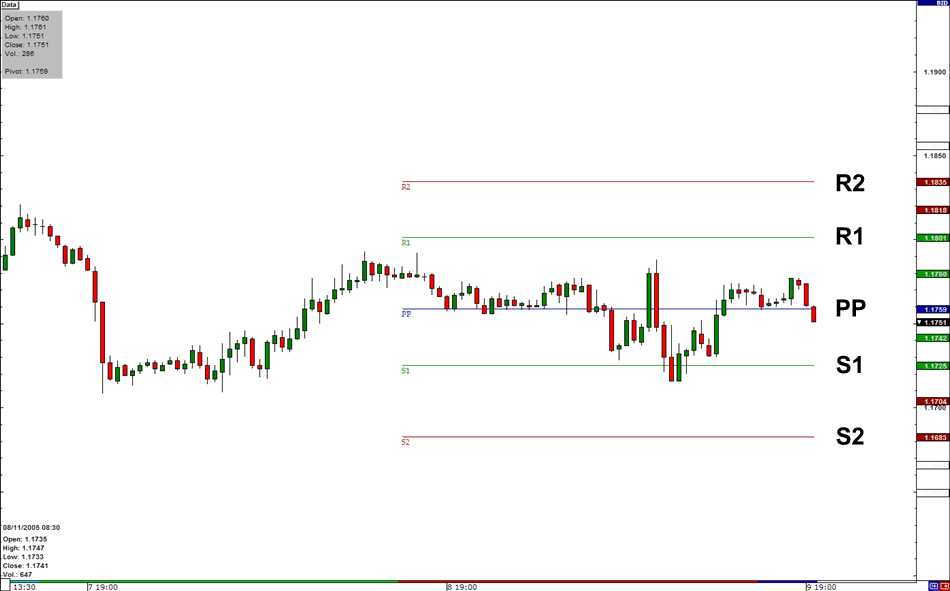
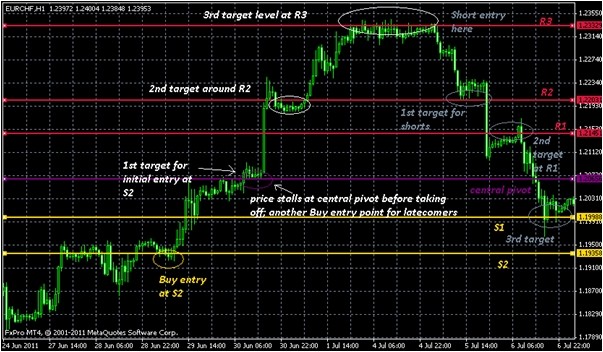
The offsets from this central pivot are considered to be either resistance levels – R1, R2 etc – or support levels – S1, S2 etc. How far you want to take these extra levels away from the central pivot is a matter of choice, personally I go no further than R2 for resistance and S2 for support.
The calculations for these support and resistance levels are mathematically simple, attained by the following method:
R2 = (Central Pivot-S1)+R1
R1 = (Central Pivot+(Central Pivot-LOW))
Central Pivot = (HIGH+LOW+CLOSE) / 3
S1 = (Central Pivot-(HIGH-Central Pivot))
S2 = (Central Pivot-(R1-S1))
The result is a chart that looks like this:
There are levels in between these support and resistance levels which can also be plotted, known as Mid-Point Pivots. The calculations to include the mid-point pivots expands our formula to the following:
R2 = (Central Pivot-S1)+R1
M4= (R1+R2)/2
R1 = (Central Pivot+(Central Pivot-LOW))
M3 = (Central Pivot+R1)/2
Central Pivot = (HIGH+LOW+CLOSE)/3
M2 = (Central Pivot+S1)/2

S1 = (Central Pivot-(HIGH-Central Pivot))
M1 = (S1+S2)/2
S2 = (Central Pivot-(R1-S1))
There are variations to the manner in which the calculations are achieved. Some people factor in the daily open as well. But the methodology described above is the most common, with the exception of the M levels which are rarely used (but powerful just the same!)
In the indicator for plotting forex pivots that I use it is possible to turn these mid-point pivots on or off (as with all the levels in fact). I choose to keep them turned on, and this is what it looks like on my chart:
I have also left the labelling of these pivots turned on for illustration purposes, but I usually turn that feature off for more clarity. I also usually employ only the daily central pivot in trading, for extra clarity on my charts. The exception to this rule is when I trade systems such as the Daily All Pivots Scalp Trade, which requires all daily pivots.
Pivot levels can also be plotted for weekly , monthly and yearly pivots. The weekly and monthly pivots are of especial interest, being more than usually reliable as points where price will react and often turn. In the following forex charting example (with only the central daily pivot plotted and labelling turned off) the the daily central pivot shows as a yellow line, weekly pivots are shown in blue. monthly pivots in green. and yearly pivots in red lines:
The forex trader would do well to investigate the use of pivot levels in their trading if they do not already employ them. The weekly and monthly pivots are especially powerful. Check out the following forex chart of the AUDUSD and note how many times price reacts at and turns from these pivots:
In the above example I have enabled back history display of the pivots, so that you can see several weeks worth of forex pivot point levels. Enabling the history you can choose any number of iterations for each pivot type: weekly, monthly etc is great for eyeballing historic data when backtesting.
Forex pivot levels are similar in some respects to Fibonacci levels. Both plot future price levels based on previous trading ranges, using fairly straightforward mathematical projections. However, Fibonacci is arguably a more advanced forex trading indicator. We deal with it in the next section of Forex Indicators
Click the following link to go to that discussion on the forex indicator Fibonacci


