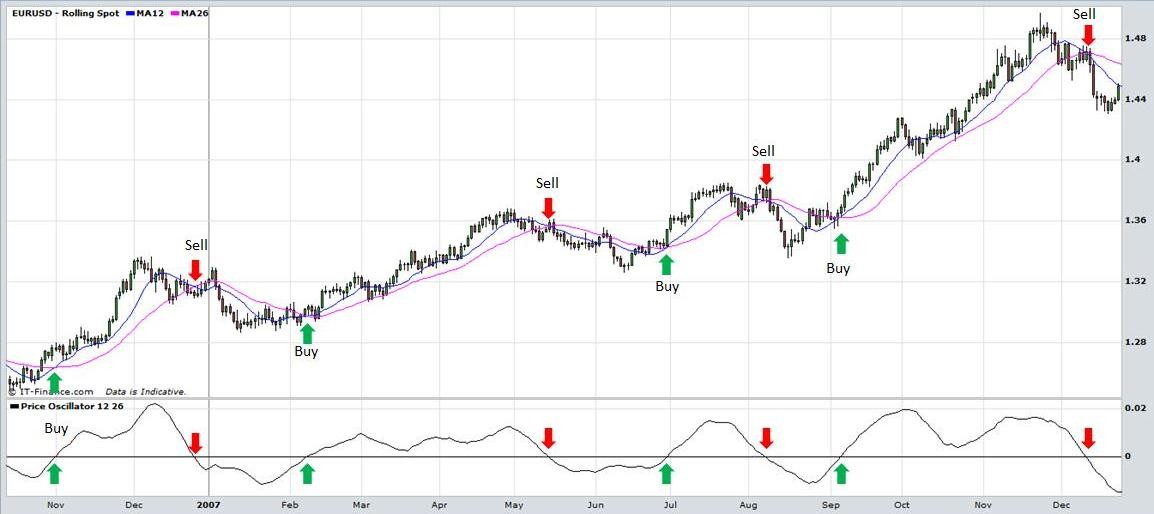
Forex Oscillators What they are and what to look out for
Post on: 18 Июль, 2015 No Comment

Forex Oscillators
Important: This page is part of archived content and may be outdated.
Indicators are the most useful tools of a technical analysis visual part. They define precise moments to sell or buy. In finance technical analysis a lot of different indicators are used but the majority of them double each other since they signalize the same upcoming events.
The whole variety of financial indicators could be split into three classes: Trend Following, Oscillators and Others. Trend Following indicators are effective when the market is moving in trend but become dangerous on stable market. Forex oscillators show firm market turning points and may send out untimely or false signals on moving market. Other indicators monitor the state of investors’ mass psych.
Being synchronous or anticipatory indicators, oscillators usually change before actual prices change and thus may help to identify a turning point. The most commonly used oscillators are Stochastic, Rate of Change, Smoothed Rate of Change, Momentum, Relative Strength Index (RSI), Elder-Ray, Force Index, Commodity Channel Index (CCI) and some other.
What do Forex Oscillators Show?
Forex oscillators show us the moments when the forex market reaches its limit in any direction and opposite correction of the trend become extremely probable. When a price goes up to high analysts say that the market is overbought. This simply means that the price will stay stable or even slide down for some time because traders are willing to fix their profits. And during negative correction new traders will enter the market, rising up the price. Respectively oversold market means opposite condition, when the price fell too much and positive correction is likely to happen. As a general rule it’s better to buy on oversold market and sell when the market is overbought. As the value of the oscillator approaches the upper extreme the asset is deemed to be overbought, and as it approaches the lower extreme it is deemed to be oversold.
There is another element in oscillators’ analysis which is also very important. Oscillators are used not only to discover overbought or oversold conditions but to foresee breaking point in a price movement. Some of them are mathematical transformations of price (first and second-order derivative) and on graphs their lines usually move in the same direction with the price. When the lines start to move apart an analyst considers that the trend is losing its momentum. Oscillators are especially useful for that.
Analysis of Forex Oscillators
So analysis of forex oscillators consists of two basic elements: first, discovering if the forex market is in short-term overbought or oversold conditions; and second, determination of dispersion with the price as the value of the oscillator approaches its extremes.
Momentum and rate of change (ROC) are the most basic oscillators. A price graph tells us if the price is going up or down. The oscillator graph then tells us about pace or speed of that movement. This type of indicators helps us to assess whether a current trend is gaining strength (momentum) or losing it. On later stages of an uprising trend rate of price increase slows down. This loss of momentum may not be seen on the price graph but is fairly visible on the supporting oscillator graph. Indicators, assessing momentum and rate of change, are fundamentally essential.
Oscillators are most beneficial when the forex charts are not showing a definite trend in either direction. In trending markets oscillators’ signals should be taken with maximum caution provided that false signals generally stand for strengthening of the trend. So the next rule of oscillator analysis is that on upward trend oscillators show overbought condition and vice versa – on downward trend oversold condition.
Major graph software programs offer great variety of oscillators in order to assist traders in defining extreme market conditions and potential price turning points. The most valuable are Momentum and Rate of Change; the next most popular are probably Relative Strength Index (RSI) and Stochastic oscillator. This type of indicators is eminently useful during fractional market movements or when a trend reaches its final phases. All oscillators lose their validity in the middle of strong trend. It’s better to use other indicators such as Moving Average on trending markets. There are also some indicators combining advantages of MA’s trend following with oscillators’ oversold overbought determination.


