Forex Moving Average Convergence Divergence
Post on: 3 Май, 2015 No Comment

Moving Average Convergence Divergence — MACD
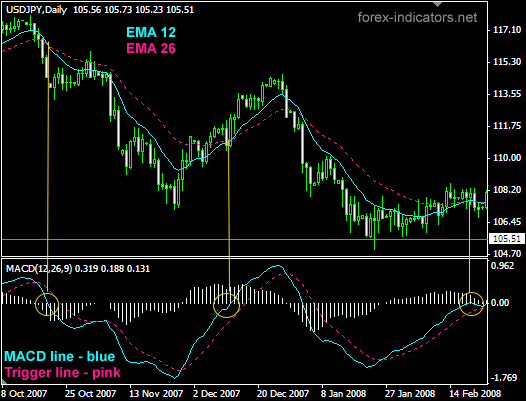
Moving Average Convergence Divergence — MACD is one of the most popular and widely used technical analysis Indicators, and also is one of the simplest and most effective momentum indicators available. The MACD indicator is primarily used to trade trends and should not be used in a ranging market. Signals are taken when MACD crosses its signal line. MACD, oscillator or histogram, shows the relationship between two moving averages of prices. The MACD is calculated by subtracting the 26-day exponential moving average EMA from the 12-day EMA (12-day EMA — 26-day EMA)=MACD Line. A nine-day EMA of the MACD, called the signal line (Signal Line=9-day EMA of MACD Line), is then plotted on top of the MACD, functioning as a trigger for buy and sell signals. MACD is unbounded, it is not particularly useful for identifying overbought and oversold levels.
Moving Average Convergence Divergence — MACD indicator was invented by Gerald Appel in the late 1970s. Gerald Appel is a recognized expert in the field of technical market analysis, author ( he has authored or co-authored more than fifteen books), lecturer and a professional investment advisor (a professional money manager, directing the management of Investor assets for more than thirty-five years). Gerald Appel holds degrees from Brooklyn College and NYU Graduate School of Social Service. The original version MACD of Gerald Appel in 1986, but was added histogram, for which we thank Thomas Aspray. (The histogram shows when a crossing occurs.) Thomas Aspray is a professional trader (mainly traded in the interbank foreign exchange market Forex), Advisor (Princeton Economic Institute, Ltd. — PEI). and analyst.
As its name implies, the Moving Average Convergence Divergence — MACD is all about the convergence and divergence of the two moving averages. Convergence occurs when the moving averages move towards each other. Divergence occurs when the moving averages move away from each other.
The traders are mostly approve three fundamental sales techniques:

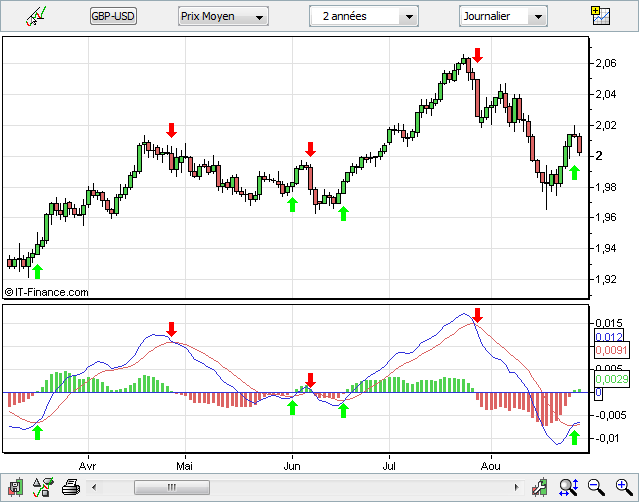
Crossovers — the Moving Average Convergence Divergence — MACD falls or increase below respectively over the signal line, which indicates that it may be time to sell, respectively buy. Traders also watch for a move above or below the zero line because this signals the position of the short-term average relative to the long-term average, by passing up Buy, down sell.
Divergence — When the security price diverges from the Moving Average Convergence Divergence — MACD. It signals the end of the current trend.
Dramatic rise indicator Moving Average Convergence Divergence — MACD, that is, the shorter moving average pulls away from the longer-term moving average, sign, that the security is overbought and will soon return to normal levels.


