Forex Day Trading Using Price Action And Pivot Points
Post on: 9 Декабрь, 2015 No Comment

Today I want to talk about how you can day trade the forex markets using nothing more than price action and pivot points. I sometimes visit a few trading forums and often come across some really complicated trading systems that use many different indicators. However the fact is that you can do just as well stripping away all of these indicators and just following price action, using pivot points for additional guidance.
So you basically want to set up a basic 5 minute candlestick chart and add pivot points to this chart.
Then if you simply study these charts really closely on a daily basis for the major currency pairs, you should start to see the same sort of patterns reoccurring, and you will soon have enough confidence to start opening and closing positions.
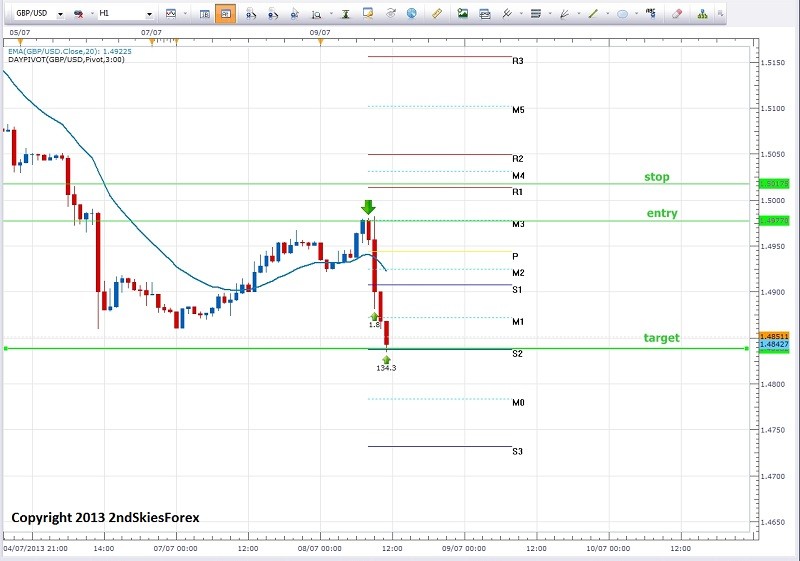
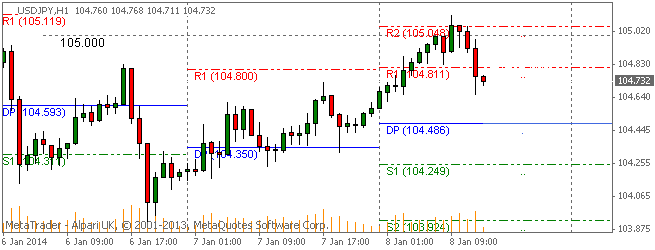
I actually placed a few trades today on the GBP/USD pair earlier today, which will hopefully show you my own thought processes when trading these shorter time frames. First of all let me show you the chart:
I should point out that I will only consider trading the 5 minute chart if the overnight trading range is small (in comparison to the average daily range). Luckily this was the case today.
The overnight trading range between 12.00 and 08.00 (UK time) was approximately 40 points, compared to a daily average of around 120 points (according to the Average True Range indicator on the daily chart). This means that there was always likely to be a decent sized breakout either upwards or downwards at some point during the day, so there were plenty of points available.
You can see from the chart that there were 4 points of interest:

FALSE BREAKOUT — The price broke down through the pivot point and closed below the overnight trading range (as indicated by the blue lines) just before 8.00. So this was a high probability trade and a great opportunity to go short. However after opening a short position at 1.6139, it turned out to be a false breakout and I closed out for -14 points after the price closed back above the pivot point.
INITIAL UPWARD BREAKOUT — After looking as if it might have another crack at breaking downwards, the price then moved sharply higher and closed above the overnight trading range. At which point you basically have two options. You can either enter a long position and hope that the breakout continues, or you can wait for confirmation. I personally went long straight away at 1.6198 after the breakout candle closed.
CONFIRMATION BREAKOUT — There was then a short period of consolidation followed by a confirmation breakout. So if you hadn't already entered a long position on the initial breakout, you could have taken a long position with more confidence at this point.
CLOSE POSITION — The obvious exit point for this trade was always going to be the first line of resistance, ie R1, and you can see that the price just about touched this resistance level at around 1.6241 before falling back downwards again. So in the end I banked a profit of 43 points from this particular trade.
Of course if you subtract the spreads and the loss from the false breakout earlier, the total profit is only around 23 points. However it was still a profitable trading day overall, and hopefully you can see how easy it can be to bank a decent profit on days like today when the overnight trading range is relatively small.


