Forex Chart Patterns Forex Early Warning
Post on: 11 Июнь, 2015 No Comment

Introduction
This lesson shows examples of common consolidation and retracement patterns that occur frequently on the spot forex. When currency pairs are not moving they are consolidating. When they consolidate they exhibit behavior patterns that occur frequently and are easily recognizable. Typically, currency pairs move in the London and US trading session then they consolidate after the first few hours of the US session. This pattern is repeated day after day. Currency pairs move; then they consolidate, then they move, then they consolidate and the pattern keeps repeating. The consolidation and retracement chart patterns will be discussed and illustrated in this lesson.
Conventional Chart Patterns
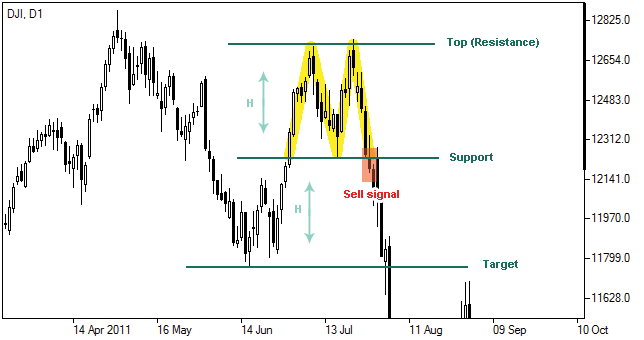
Some conventional chart patterns occur frequently on the spot forex. Forex traders need to focus on recognizing pennants, flags, double tops, double bottoms, ascending and descending wedges, and oscillations. These chart patterns are easy to recognize and occur frequently on the spot forex, they can also help to confirm your trend direction or in some cases a potential reversal.
This leson is not filled with a lot of general information about forex charts or general chart patterns from all markets. The examples and illustrations in this article really do occur weekly on the spot forex week after week. If you look at various time frames across a lot of pairs you will see all of them clearly over time.
As a starting point and to get any forex trader familiar with some generalized chart patterns please check out Chartpatterns.com . This website will get you started and give a forex trader a general feel about chart patterns and some generalized picture and sketches.
Our objective, however, is to give you specific chart patterns that occur frequently on the spot forex, not some generalized chart course. Reviewing Chartpatterns.com is only meant to get you oriented to to the subject matter, specific forex chart patterns that occur regularly are below.
Please Note . There is a difference between a forex chart pattern and a technical indicator. A chart pattern is something you can see on a bare bar chart with no indicators added. A bare bar chart is an open high low close chart, without any indicators added at all. Examples are below.
As a matter of fact most technical indicators mask the bare chart patterns because most forex traders attach so many layers of technical indicators to their charts you cannot see any basic chart pattern behind them. Forex traders may have a double top right in front of them, but cant see it because of all of the interference from the layers of technical indicators masking the bare chart pattern.
In the charts below with the black background there are some simple moving averages attached to the charts but the basic bar chart patterns are still very obvious.
Chart Pattern llustrations
The following illustrations have two kinds of examples. Some of the illustrations and pictures and generalized examples or hand sketches of typical forex consolidations and chart patterns. Some of the pictures and illustrations with the black background are actual forex charts.
Bull Flag With Out A Retracement
This is a very straightforward bull flag. Put the price alarm above the highs (1-2) and intercept the next move up. In this case the pair consolidates between points 1 and 2 but it does not retrace. This consolidation generally occurs in a trending market in both directions. Most often it occurs on intraday time frames line M5 and M15, although they can occur on any timeframe. This is a bull flag but there are also bear flags for downtrends.
Bull Flag With A Retracement
This is one form of a bull flag but the area from point 1 to 2 is a retracement. Occurs on the intra-day time frames like M5 and M15 in a trending market but can occur on any time frame. The trend on this pair is up.
Increasing Tops and Bottoms
Increasing tops and bottoms in an uptrend. The down cycles are consolidations and at the bottom of each down cycle a relative low is formed. Each relative low is the trough of the cycle and are all entry points when they turn back up. When you see this on a H1 time frame or larger, trade it. Please remember that this can happen in reverse within a downtrend, decreasing tops and bottoms.
Choppy Market

The illustration above is a currency pair in a tight choppy range, the bottom illustration is a currency pair in a wider choppy range or support/resistance cluster. When a currency pair is choppy in a tight range or wide range this is essentially a consolidation.
Oscillations
An oscillation is really a consolidation because there is no net movement. Another way to view it is that the tops and bottoms of the oscillation cycles are also consolidations. Oscillations can occur on any time frame but for a potential trade you would look for the H4 time frame charts or larger to be oscillating so there is more pip potential. This occurs frequently when the market is not trending or after very large moves over weeks and weeks. If a currency pair is not trending it is likely oscillating in some fashion.
Ascending Triangle
This is an ascending triangle, each down cycle is a consolidation and retracement. Buyers keep coming in until the top resistance is broken. Eventually the pair breaks out to the upside. This can occur on small or large time frames. Ascending triangles occur frequently and signal a trend continuation to the upside. Downward descending triangles also occur. Increasing bottoms and steady resistance tops. Trend direction is up as indicated by the red arrow. Breakout point and price alarm above resistance.
Head and Shoulders
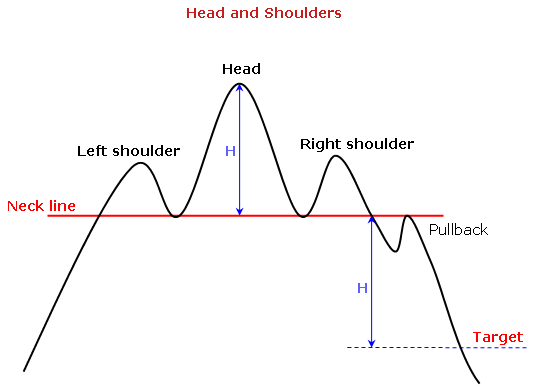
The right half of the chart is also two decreasing tops, which is bearish. You can also have inverted head and shoulders, which is bullish. Head and shoulders occur very rarely on the spot forex. Do not look at the charts to try to manufacture one or force one into your thinking.
Flags
Descending Triangle
Decreasing tops and steady resistance bottoms. Trend direction is down indicated by the red arrow. Breakout point and price alarm below support.


