Fibonacci Trading_1
Post on: 27 Июнь, 2015 No Comment

Fibonacci
Important: This page is part of archived content and may be outdated.
Fibonacci trading has become rather popular amongst Forex traders in recent years. Nevertheless, have you ever wondered where such a technique came from? The trading technique of Fibonacci came from an Italian mathematician who lived back in the thirteenth century in Italy. His name was Leonardo Fibonacci.
Fibonacci expanded his studies back in the thirteenth century and led to create today’s understanding of the Fibonacci technique.
What did he discover?
Fibonacci went on to discover a specific number sequence that was applied to natural proportions of matter- nature and the universe.
The Fibonacci number sequence
1, 2, 3, 5, 8, 13, 21… …
Each number in this Fibonacci number sequence is found simply by adding the two previous numbers together. For instance, 2+ 3= 5 and 5 + 8=13
Fibonacci continued his mathematical studies and expanded his number sequence to discover the ‘Golden Ratio’ as known today in the Forex market. The ‘Golden Ratio’ was determined by dividing any number after 3 by the next consecutive number. The answer would be 62.5. As you go higher up in the number sequence and perform the same calculation, the resulting ratio would be 61.8%. This 61.8% is identified as the ‘Golden Number’.
Although Leonardo Fibonacci was not the first person to recognize such repeating patterns and ratios of the universe, his study of the number sequence is what is so famously known today in the Forex industry.
How is the Fibonacci number sequence used in Forex?
The ratios that are used in Forex trading utilize this ‘Golden Number’ and also use the additional stages of this ratio. These additional stages are 23.2%, 38.2%, 50.0 % and 61.8%. 0.0% is the reference of the low of a move while the end of the move is identified as 100.0%. By using such levels in Forex, traders are able to project price contractions and extensions inside the market.
Fibonacci retracement levels
If it were not for a well known mathematician who lived in the thirteenth century, Forex would not be accompanied with the successful trading system that is known as Fibonacci. Leonardo Fibonacci discovered the Fibonacci sequence, and the use of this strategy has become so widely popular and profitable for traders in the forex trading industry.
Interestingly, the use of Fibonacci retracements and extensions originated when Leonardo was merely trying to calculate the amount of rabbits he was able to breed. Funnily enough, because of this, the Fibonacci number sequence was discovered. The Fibonacci sequence has been applied to so many aspects of the universe, however its success and practicality in the Forex market is outstandingly useful to traders.
So what is it that makes this number sequence so special?
Each number in the Fibonacci sequence has a specific mathematical relationship. They also have a certain unique aspect, which is the consistent result of 0.618 when each number is divided by the previous number and the next number. 61.8% is a very significant number for a trader in the Forex market who decides to use the Fibonacci retracement levels. Other common numbers used by traders can be 38.2% or 50%.
Applying Fibonacci to Forex trading and charts
Usually, an automatic program will help apply Fibonacci methods into a trader’s chart. Nevertheless, the main steps taken would be a trader drawing a line from peak to trough or vice versa regarding whether the market is moving up or down. The trader would then calculate where 38.2%, 50% and 61.8% would fall on the line drawn.
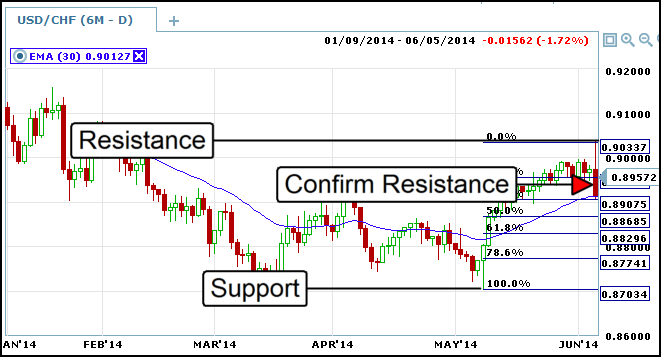
Support and resistance levels are the lines formed by the Fibonacci retracements.
The disadvantage to be aware of
Although the disadvantage of Fibonacci in the Forex market is very minor, it is something that traders must be aware of. Sometimes the market does not thoroughly respect the Fibonacci retracement levels.
The market generally does respect the sequence price levels however there are times when the market will totally ignore the resistance lines. Positively though, the market does sometimes pause at the Fibonacci levels, giving the trader more of an opportunity to close or enter a trade.
The controversy regarding Fibonacci in Forex
There have been so many various arguments defending or brutalizing the affect of Fibonacci in the Forex market. Some people have stated that the Fibonacci retracement numbers are ordinary stopping points for price movement that is based on the trader’s emotion. However others argue that the numbers are used instead as a self-fulfilling prophecy due to the wide usage of the Fibonacci retracements.
The Fibonacci retracements and extensions have become so popular and successful in the Forex market, while the results and profits which many experienced traders will argue that it is one of the best proven trading methods in Forex.
It is advised by many throughout the industry to try out Fibonacci retracements. After reading this summary regarding Fibonacci in Forex, we hope that you have learnt a little about the origins of Fibonacci, the technical applications and how it works, as well as the arguments defending and assaulting it.
Fibonacci retracement levels allow traders to identify an area where they can place transactions. These defined areas are based in the Fibonacci ratio. Traders are able to witness approximately where the market will pull back to following a move. This can be referred to as a Fibonacci support level in an up trending market. On the other hand, in a down trending market it is referred to as a Fibonacci resistance level. Traders analyse these Fibonacci levels to later determine whether or not they can position themselves to enter the preceding trend subsequent to a retracement competing.
Fibonacci extension levels
A trader will use Fibonacci ratios in this case, as price targets will be used to close an order and take profits. Fibonacci extension levels are utilized in predicting how far a move can go unlike retracements that are used to profit after a market move. Traders will enter and watch such points in the market with their own decisions and choices. This has led people to argue that Fibonacci extension levels have developed into self-fulfilling prophecies.
How do you calculate Fibonacci levels?
Fibonacci levels are easily calculated through a Fibonacci calculator by entering the high and low of a move. You then later apply these to your individual charts.

Fibonacci trading has undoubtedly been successful to use for most traders in the Forex market. Yes, it requires a lot of understanding about how to use it, but eventually it becomes very profitable. However every trader must also use indicators and not only solely rely on Fibonacci methods during their trades. The tools used in Fibonacci trading should at some point become an essential addition for your trading gear and strategy.
Using Fibonacci in Trading
Being new to the Forex market can be quite threatening and confusing when considering all the vast amount of information there is to understand. One of the main strategies that a trader must be aware of is Fibonacci trading. By using and fully understanding this method, any trader has the prospect of gaining profits for his/her Forex account.
The Fibonacci strategy routes from a genius mathematician named Leonardo Fibonacci. If it weren’t for Leonardo’s clever discoveries, traders would not be using such a great technique during their trading activities.
Leonardo Fibonacci created a number sequence that is well known today; 1, 2, 3, 5, 8, 13 etc. Fibonacci went on to discover that every number after 3 that is divided to the consecutive number results in 0.618. It also came about that the ratio of every alternative number is 0.383 etc. Generally speaking, the Fibonacci number sequence became so well known because the ratios are all the same and it is referred to as the ‘Golden Mean’.
Here are some general facts needed to know when using the Fibonacci strategy in Forex trading:
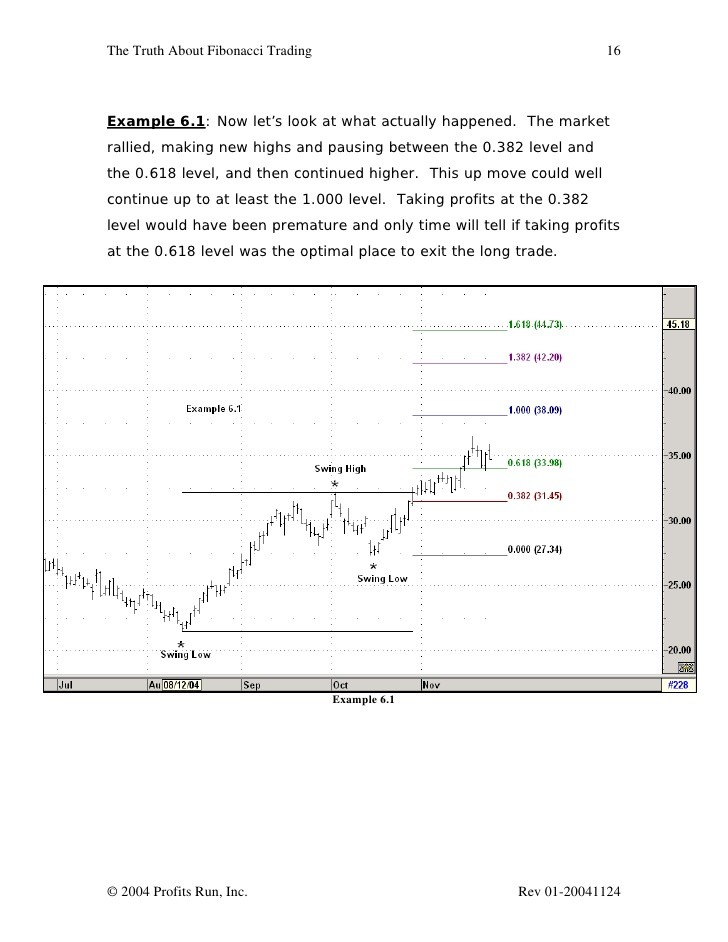
- A Swing High is the highest point on the graph in the timeframe that the trader is concerned about.
- A Swing Low is the lowest point on the graph in the timeframe that the trader is concerned about.
- In Forex, the ratio numbers are placed between a Swing High and a Swing Low whether it’s on an uptrend or a downtrend. They signify support and resistance levels for a trend to take. After plotting the ratio, the results that appear on a chart are named a ‘trace’.
The two types of Fibonacci traces are Fibonacci Retracements and Fibonacci Profit Targets.
Fibonacci Retracements: These levels identify for a trader the lowest places to buy when a trade is moving up in value. In general, Retracements are mini support levels.
Fibonacci Profit Targets: This is the highest expected level a trade is anticipated to reach. Profit Targets are a form of mini resistance levels.
- Fibonacci Retracements are charted with a Swing High and a Swing Low. By choosing both, the charting software ends up processing all the work for the trader. The chart then presents Fibonacci levels. As a new trader it is best advised that the directional move is 25-30 pips or perhaps more. He/she should also buy on the 50% or the 61.8% level.
- Fibonacci Profit Targets are commonly placed above the Retracement levels.
Traders usually pull out of a trade at mini resistance levels.
- Combining the Fibonacci trading system with further indicators and oscillators produces more efficient and accurate results.
- If 10-15 pips are risked on a specific Fibonacci trade, traders receive 40-50 pips in return and they sometimes leverage this to generate more funds.


