Fibonacci Retracements in Forex Trading
Post on: 27 Июнь, 2015 No Comment

8.1. What are Fibonacci Retracements?
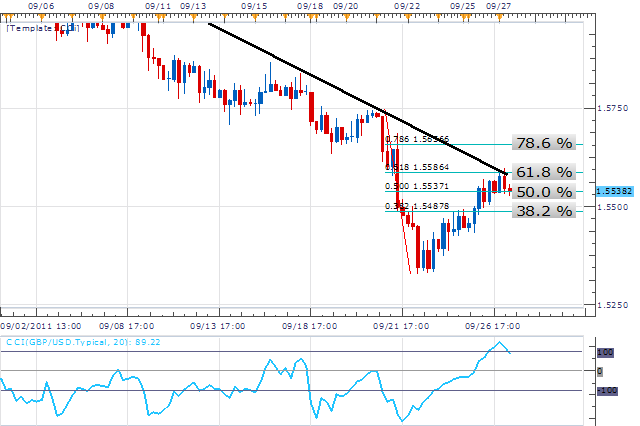
Fibonacci retracements are percentage values which can be used to predict the length of corrections in a trending market. Most popular retracement levels used for the forex trading are 38.2%, 50%, and 61.8%. In a strong trend you can expect the currency prices to retrace a minimum of 38.2 percent; in a weaker trend corrections may go as far as 61.8 percent. The 50 % is the most widely monitored retracement level and is a common area to buy in the up trends or sell in the down trends. If a correction exceeds one of the retracement levels — look for it to go to the next (e.g. to 50% after the 38.2% level or to 61.8% after the 50% level). Whenever the prices retrace more than 61.8% of the previous move (on a closing basis) you can expect them to return all the way back to the beginning of the trend.
Fibonacci retracements in an up trend
Fibonacci Retracements in the Up Trend
Click to Enlarge.
Fibonacci Retracements in the Down Trend
Click to Enlarge.
Fibonacci retracements were derived from the similarly named mathematic sequence, discovered by the 12th century mathematician known as Fibonacci. This sequence has been found in numerous objects throughout nature — from the number of the flower petals to the way the spiral galaxies in the outer space are constructed. In this series each successive number is the sum of the two previous numbers: 1, 1, 2, 3, 5, 8, 13, 21, 34, 55, 89, 144 and so on (e.g. 1 + 1 = 2, 1 + 2 = 3, 2 + 3 = 5, 3 + 5 = 8, etc.). Any given number is roughly 1.618 times the preceding number (e.g. 144/89 = 1.618) and approximately 0.618 times the following number (e.g. 89/144 = 0.618). Consequently, 38.2% is the result of the division of 0.618 by 1.618 and 61.8% is the result of dividing 1.0 by 1.618.
Forex market being the largest market in the world most closely comes to operating like a huge natural mechanism whose behaviour can be explained by the laws governing other natural phenomena. This is the reason why fibonacci levels work so well on the forex market. In the same fashion that the bigger numbers in the fibonacci sequence give closer ratios to 1.618 and 0.618 so the larger currency movements are more likely to be followed by more precise corrections of either 38.2%, 50% or 61.8%.
Quote: The emotional crowd acts according to nature. Fibs uncover the concealed interface between mathematics and emotion as they predict how the herd will respond to price development, Alan S. Farley in his book, The Master Swing Trader: Tools and Techniques to Profit from Outstanding Short-Term Trading Opportunities .
Quote: Thomas of Aquinas described one of the basic rules of aestheticsman’s senses enjoy objects that are properly proportioned. He referred to the direct relationship between beauty and mathematics, which is often measurable and can be found in nature. Man instinctively reacts positively to clear geometrical forms, in both his natural environment and in objects created by him, such as paintings. Thomas of Aquinas was referring to the same principle that Fibonacci discovered., Robert Fischer, in his book, Fibonacci Applications and Strategies for Traders .
8.2. How to Draw Fibonacci Levels:
To draw fibonacci retracement levels start by calculating the pip distance (e.g. 200 pips) between some recent high and low (as soon as a price swing has occurred). These points can be the highest and the lowest prices seen during complete price moves within the trend (e.g. minor rallies for an up trend or minor declines in a down trend, whose trendline has been broken) or during the whole time the trend has been developing. As a second step, find the percentage of this distance corresponding to each retracement level (e.g. 38.2% of 200 is 76 pips; 50% of 200 is 100 pips; 61.8% of 200 is 124 pips). Finally, subtract each of these pip numbers from the high point for an up move or add them to the low point in the case of a down move. The following examples illustrate these steps:
Fibonacci retracements calculated for a strong down move visible on the daily USD/CAD chart
Click to Enlarge.
Note: All modern forex charting packages will draw retracement levels for you automatically — just pick a top and a bottom.
Note. You can use our web-based Fibonacci Calculator (Please note: This calculator requires that Javascript is enabled in your browser)- to quickly calculate exact retracement levels for the moves that you observe in your forex trading.
8.3. Using Fibonacci Retracements in Forex Trading

You can use fibonacci retracements to add to your existing position or to initiate new trades — in accordance with the underlying trend. Whenever the currency prices get overbought or oversold you can expect a correction to develop, which should have a high probability of stopping at one of the fibonacci retracement levels — thereby providing you with a low risk/high reward trading opportunity .
The 38.2% and the 61,8% retracements visible on the daily EUR/CHF proved to be excellent levels to buy the pair.
Click to Enlarge.
50 percent retracement presented lucrative sell entry level during the EUR/NZD downtrend, visible on the hourly charts.
Click to Enlarge.
There will sometimes be more than one retracement level close to the price action. Some of these levels will belong to the longer-term price movements, visible on the charts of higher time-frame (e.g. daily or weekly charts). It pays to keep track of these larger levels — as formidable support or resistance areas — and take them into account when planning your trades. As a general rule, when there is the convergence of fibonacci retracement levels from different-length moves the strength of this level or area will increase. The larger the moves from which the retracement levels originate and the more of them coincide — the more important this area becomes.
Click to Enlarge.
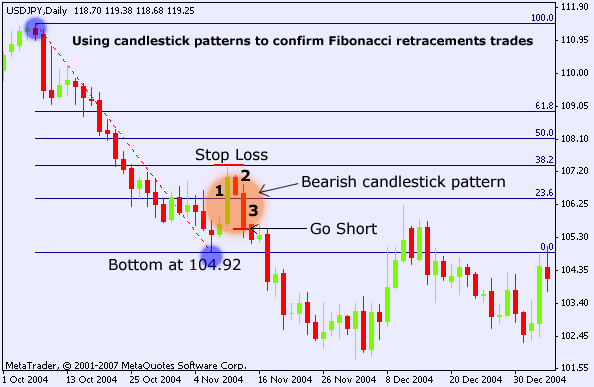
If the other technical analysis tools confirm the existence of support or resistance at some fibonacci retracement level — this increases the chances that the currency prices will reverse at this level. The more technical studies line up with a retracement level (for example, a reversal candlestick pattern accompanied by Stochastics turning back from an extreme reading) the more likely it is that the correction will be completed by it. For more information on using different tools to confirm validity of support or resistance please visit the support and resistance page. The following examples illustrate this principle.


