Failed breakout trading strategy
Post on: 11 Август, 2015 No Comment

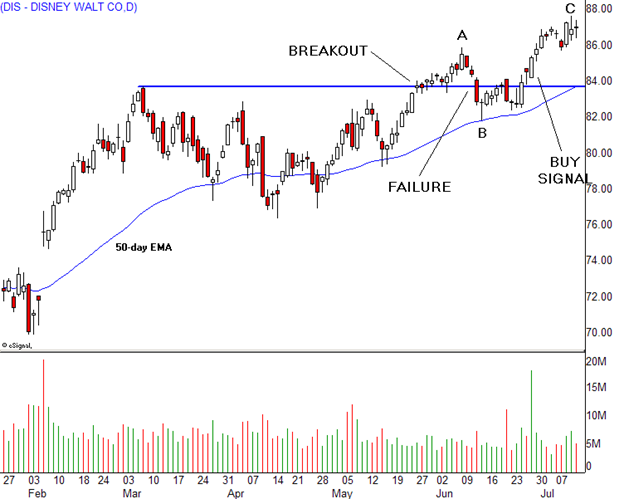
Many Forex trading strategies are based on breakouts. Breakout takes place when price moves out of established trading range, a pattern or simply above/below previous high/low. Latest price extremes often provide support/resistance, violation of which constitutes a breakout. A lot of my trades rely on just such action. However, by some accounts, breakouts are not very reliable. Many studies have been done about reliability of this approach, and while results are inconclusive, truth is that many breakouts are unsuccsessfull, at least initially. Odds for breakout strategies can be improved by careful trade selection, but that is not a subject of this post.
Quite a few traders simply take a view that breakouts are unreliable, therefore fading them is the correct thing to do. Thats also oversimplification, because nothing in trading is that obvious. When price goes through high or low, it is very difficult to tell if it is going to continue or reverse. Some clues could be gathered by seeing the order book, but in Forex it is either impossible, or the book one has access to is only a small fraction of total FX activity and is marginally useful. Besides, many traders step in around these levels at the market, without placing limit orders before. There are arguments that breakouts fail more often than not because of the stop hunting practice. Whatever the reason, many fake out methods have been devised.
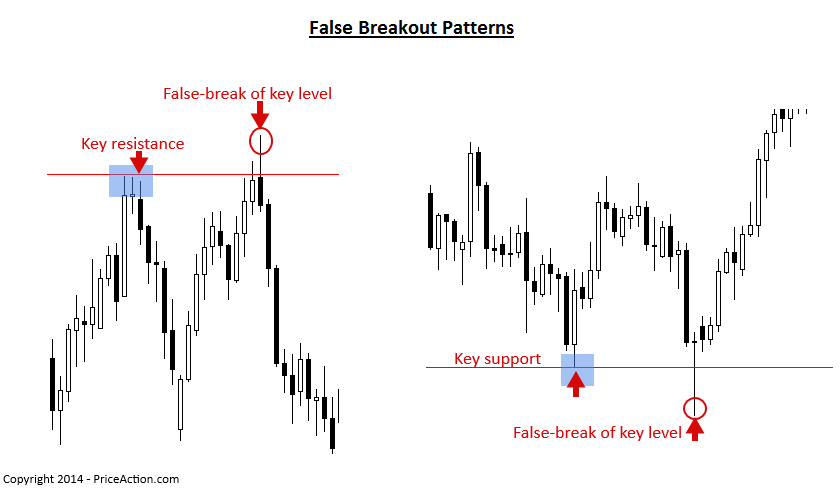
For example, virtually all divergence strategies are hoping for a false breakout. Price makes new high or low, but indicator used in the analysis doesnt follow, creating divergence. Of course, simply fading something is not enough. Just like any trading strategy, one also has to develop rules for entry, targets and stop losses. This can get as simple or as complicated as any other approach. One of the simpler, yet effective method, is using single reversal candlestick patterns IF they happen right at the breakout levels. Mostly hammers, shooting stars and doji.
These formations have one common characteristic long shadow, or wick, in relation to the total size of the candlestick body. Price moves in the direction of the potential breakout, but fails to maintain momentum and by the close of of time period loses big chunk of the advance. Time period applies to the chart time frame in use. For hourly chart it one hour, for 5M chart its is 5 minute period single candle. If the price goes through support/resistance level, possible breakout, but that very candlestick closes as a reversal pattern, chances are good that the move will not progress, at least not right away. Conditions are ripe for a fade trade.

On this hourly chart of NZD-JPY we see the price moving above previous high, at point A. Breakout doesnt have a the legs and candle closes well off the highs, leaving behind the long shadow. Correct entry would be to sell it at the close of this candlestick. This means that one has to be alert and watch how price develops, since the action is decided at the close of active candlestick. It can not really be pre-set and left to the mercy of limit orders. This simple strategy offers well defined stop, at the high of our entry pattern. Objective could be set by applying Fib numbers, but there is another solution — setting target to twice the size of the risk.
In this example, risk would be about 15 pips so objective of 30 pips is correct. Once the trade is initiated, it can be set and forget. I prefer using it on small time frames 5M and 15M and on the currency pairs with most liquidity. This means smallest spreads. Since entries are very precise and must be done at correct time, I only apply this technique when watching charts in real time, so they tend to be short term trades.
On this 5M chart of GBP-USD price breaks the support but reverses immediately. With stop just under the low of the hammer, risk is about 15 pips, indicating 30 pips objective. Even though I mostly use it for very short term trading, which means infrequently, strategy is suitable to any time frame. Biggest challenge is choosing which price level to watch, just like trading breakouts. Impossible and not prudent to try and trade each every price move. However, once a trader decides why given support or resistance is important and worth watching, this strategy can be very useful for fading breakouts. Set up happens rather often, is easily identifiable and has a good track record.


