Exponential Moving Average in Stock Trading
Post on: 23 Июнь, 2015 No Comment

by David A. Todd
Once a trader of stocks, commodities, or Forex decides to base trades on technical analysis rather than economic fundamentals, indicates are needed to signal times to buy or sell. Moving averages are one such indicator, long used by both novice and sophisticated traders. The exponential moving average (EMA) is a variation that has also found favor with traders.
Moving Averages Indicate Trends and Trend Changes
Day to day stock price fluctuations can cause a trader in stocks to misread a current trend, or to miss a good point to enter or exit a trade, especially when prices are highly volatile. A moving average over a sufficient number of periods tends to “wash” out the “noise” of price fluctuations and show clear trends.
A rising moving average shows market (or stock) strength, and a falling moving average shows weakness. Traders have used moving averages to make buy and sell decisions. “A buy signal is generated when the security’s price rises above its moving average, and a sell signal is generated when the security’s price falls below its moving average. [Achelis, page 205].
Simple Moving Average vs. Exponential Moving Average
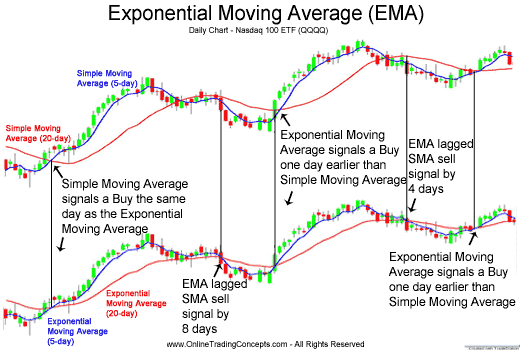
A simple moving average (SMA) gives equal weight to each value in a given period, while an EMA gives greater weight to the latest values. The most popular moving averages are of a stock’s (or other security’s) closing price. Figure 1 is a stock chart over a six month period, showing the closing price and a 20 day simple moving average. This clearly shows how the SMA is smoother than the actual closing price. However, the turns in the SMA lag the turns in the price, and trading decisions could be better timed.
Figure 2 is the same stock over the same time period, with both the 20 day SMA and 20 day EMA shown. Notice how the turns in the EMA are closer to the turns in the stock price. Notice how the turns in the EMA are closer to the turns in the stock price.
The calculation of an EMA is made by taking a percentage of the most recent closing price and a percentage of the moving average of the prior period’s closing price. The percentages can be varied, but 20% to the current closing price and 80% to the older prices seems fairly common.
How Traders Use the EMA
The EMA can be used by traders the same way that SMAs are used. When a stock price crosses the EMA it’s time to buy or sell.
Another way the EMA is used is in combination with one or more SMAs to clearly see a trend and judge how long- or short-term it is. The trader may judge the timing of trades, or the adding to or reduction in a position from the combination. Figure 3 illustrates this.
The 13 day EMA, 20 day SMA, 50 day SMA, and 200 day SMA are shown on a candlestick chart of the same stock and time period as in the previous figures. Notice how, during the up-trend from early July into September, the stock price pulls back and approaches the EMA, after which the price reverses and continues its previous rise. These pullbacks in price are a time for traders to accumulate more shares. Investors can also profit by timing purchases of more shares to these pullbacks.
The exponential moving average, used in a manner similar to a simple moving average, or in combination with simple moving averages and/or other indicators, can help a securities trader improve profits.
References:
Stephen B. Achelis, Technical Analysis from A to Z, 2nd Edition; pages 203-209; McGraw-Hill, 2001
Martin J. Pring, Technical Analysis Explained. 4th Edition; pages 154-173; McGraw-Hill, 2002


