Does technical analysis really work in Betfair Trading
Post on: 30 Июнь, 2015 No Comment

Technical analysis is popular in financial markets like the stock exchange. Since Betfair is a betting exchange and odds fluctuate like stock prices one could say that technical analysis may also be applied to the Betfair betting graphs. Betfair trading has quite a few differences compared to stock or forex trading though, but basic technical analysis tools should work just the same. However, many Betfair traders continue to doubt the effectiveness of support and resistance levels or reversal patterns and dismiss technical analysis. Are you one of them?
Learn about Betfair trading and read the latest news about sports trading in my new trading blog!
A large proportion of my blogs traffic seems to be coming from forums or websites discussing Belfair trading and technical analysis in particular. They are usually internet places where Betfair traders discuss their own strategies and more often than not the original poster wonders whether a Betfair trader could apply technical indicators and tools on Betfair charts profitably. My trading blog gets mentioned somewhere along the discussion taking place but the replies that follow are almost all pessimistic about technical analysis profitability and capability in correct predictions. So it was about time I shared my own view about the subject.
Obviously I think technical analysis works in Betfair trading. Why? Well, if I get asked whether technical analysis work in stock trading, what would I respond? Of course it works there as well. Again, why? Odds and stock prices move due to news, facts, financial or betting data and certainly due to crowds psychology. Technical analysis help us in finding out quickly and easily the psychology of the traders or bettors. If we see a declining trend line in a horses Betfair graph, we are certain that something influenced the crowd to bet a lot of money on that horse. We may not know what triggered that bets, but whatever it was, it surely led the odds to steam.
Surely the indicators dont always work. We may enter the market at the end of a rally, or open a trade at a false reversal point. A loss is almost certain in both situations and sequential losses will make the traders mind lose focus and will result in loss of confidence. The trader will stop trusting technical analysis and try to find other profitable ways to make money in Betfair markets. But we all know everything I already said, how come I believe technical analysis work in betting markets?
Technical analysis is a way of predicting the odds movement. Sometimes it will predict correctly, sometimes it will make a mistake. False predictions are expected! Technical analysis as ANY OTHER prediction method has its percentage of success. If it could predict whether the odds will climb or fall 100% of the time, it would be the Holy Grail, the Golden Goose and so on. There is no such thing. It is just one of many methods of odds or price prediction. A trader could also predict a movement by looking at the weather, if it sunny he would start by laying predicting a drift, if it is rainy he would expect a price drop. His method would again rise eyebrows and more traders now would question his method. However, if his method succeeds more than 50%, why blame him? He is making money for crying out loud!
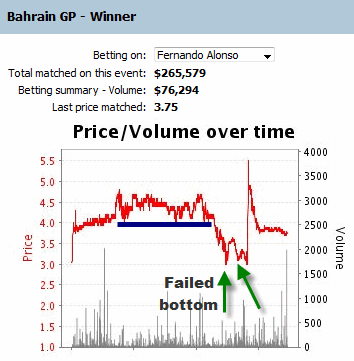
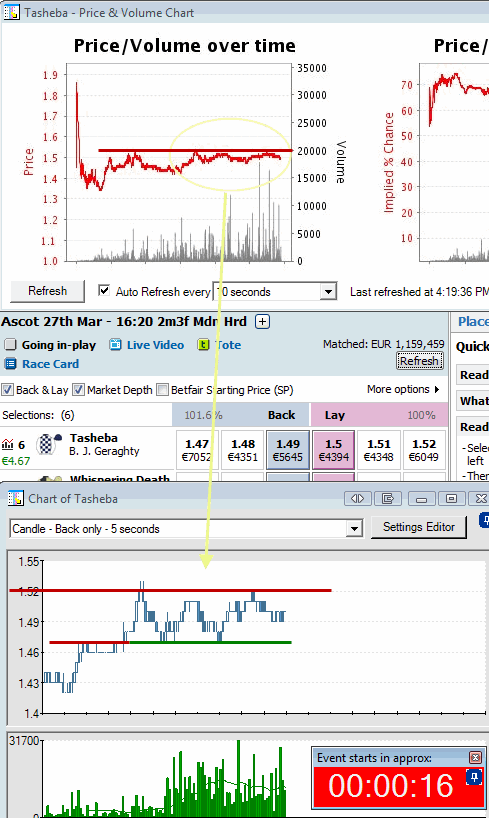
Regarding technical analysis, many posters claim that support and resistance lines dont work in Betfair charts or betting markets dont behave like the financial markets so we cant use the same tools. I agree with them that Betfair graphs dont provide enough data or are easy to plot many indicators on. However basic elements of technical analysis like support and resistance lines or trend lines can be drawn and be used. Now, how effective are they?

It really depends on the trading strategy. If a trader trades for a couple of ticks, he might get outplayed by trading noise, that is small radical odds movement which will lead to closing his trading position early. If on the other hand he is willing to risk 10 ticks to win 2 when the odds line reaches a major support or resistance level, he will have a lot of small winning trades and a few big losing ones. However, if he succeeds winning trades more than 85% of the time, he will make a profit in the long run. 8.5 times out of ten he will make 2 ticks (17 ticks), 1.5 times he will lose 10 ticks (15 ticks). In the end he will be making 0.2 ticks per trade in the long run.
Does technical analysis work for another trader that uses the same support and resistance levels but applies a different approach, say to lose 5 ticks in order to win 3 with 60% probability? No, it doesnt because 6 times he will make 3 ticks (18 ticks), 4 times he will lose 5 ticks (20 ticks). He will be losing 0.2 ticks per trade, thus he will never look back to technical analysis. Its not the analysis that has flaws though, its the trading system itself.
Technical analysis provide us with the tools, its up to us to make them work and make money out of them. By studying a little about technical analysis, we will get quickly familiar with trend lines, reversal and continuation pattern formations. The next step is identifying them on the real Betfair charts which again is not that difficult. But then comes the most challenging aspect of applying technical analysis on Betfair betting graphs: Analyzing success percentages, winrates and probability odds of different trading systems until we figure out the profitable trading strategy.
Oh, of course there is one final step. Proper money managemen t and be disciplined enough to follow our trading systems rules.


