Currency Trading Charts Explained Forex Blog
Post on: 1 Апрель, 2015 No Comment

The foreign exchange (Forex) market is the worlds largest financial market transacting on average over $5 trillion per day in trading volumes, across the worlds various currencies, as the flow of capital in and out of economies affects the actual value of exchange rates. Forex prices are used to make individual and corporate payments, investments, and commercial transactions, when converting from one currency to another, as well as to balance central bank monetary policy, and these rates are then plotted on graphs known as currency trading charts.
One such driver of market prices is the individual and collective perception of foreign exchange market participants, when observing historical price action and its relationship to current prices, in order to forecast or base their future market expectations upon and when making trading decisions in the present moment or when planning a trade.
Understanding Currency Trading Charts Explained
Making sense of complex graphs and charts containing financial market data can be a tedious process for new entrants and beginners to the world of investing and online trading, and in an effort to help provide a greater level of understanding.
The last post on forexblog.com about understanding currency trading charts explained various methods of approach and the reasoning behind using charts, and the direct connection that charting can have to make trading decisions and investing. The AlphaTrader platform provides nine different chart types that are of the most commonly used in online forex trading, including:
- Candle Chart
- Bar Chart
- Line Chart
- Area Chart
- Point and Figure Chart
- Renko Chart
- Kagi Chart
- Three Line Break Chart
- Heikin Ashi Chart
- Tick Chart (listed under time-frame but not time-fixed).
Below are examples of different chart types which will reveal that a different picture can exist for the same trading instrument even when looking at a similar time-frame, since the manner in which the data is represented, and the meanings and method behind the formula within the chart, all effect the end result that traders look at when using currency trading charts.

The Past Doesnt Equal The Future But May Leave Clues
The first thing to remember is that currency trading charts explained the past already, and never the future (except for price projections and forecasts), as the future is still unknown, even though the latest price may be in the chart, such as in a freshly printed chart, or a dynamic one that updates in real-time, and continuously streaming, all such rates are fleeting and immediately a thing of the past.
This is important to remember for several reasons, firstly because any patterns or trends or non-random appearing data within a trading instruments price history have already occurred, even though some of the trend lines may be extended into the future if permitted within the charts functionality.
Therefore, while it may be easy to see or detect in hindsight, the question should be was it noticed before it developed, during its developement, or was it missed altogether? And finally, what trading decisions were made or missed and what was the opportunity-cost missed or profit/loss realized? Such an approach is used when back-testing a trading system in order to calculate how it would have performed over a given historical time frame.
Currency Trading Charts Explained: Approach to Observing Historical Data
In essence, a chart is only as powerful as the manner in which it will be used, which is nearly entirely dependent on the trader or computer program, and the meaning derived from observing the specific historical information within the currency trading chart.
For this reason, understanding currency trading charts explained in a way that can help traders derive such meaning is a basis for being able to properly analyze foreign exchange rates, including their history, and while conducting technical and fundamental analysis. This is because these methods of analysis affect prices as they are used by a significant portion of market participants, and therefore have a collective affect. Thus a proper approach to analyzing market prices is an important part of almost any forex trading system .
Chart Basics: Instrument, Chart-Type, and Time-Frame
The basics for any X/Y chart or graph are typically the two data sets plotted on the X axis and the Y axis. In foreign exchange this is typically represented as Time and Price, although can vary depending on the charting application found within the forex trading platform.
It is always a good idea to check what instrument the chart represents, as a EUR/GBP chart at first glance could look like a EUR/USD chart, or some other mix-up, and therefore knowing what asset the price reflects is a good habit to get into when trading, in order to avoid mistaking one price or pair for another.
In addition, knowing how to change the charts time frame, settings, and adding tools, indicators and other analysis tools or line-studies is a good thing to do in a forex demo trading account. before opening a live account.
Currency trading charts explained nearly every major financial event whether boom or crisis but almost always in hindsight. However, many analysts, market technicians, members of academia, and other researchers, and even non-professional traders, from time-to-time may see a pattern or trend developing, and eventually see their expectation subsequently either confirmed as truth or false.
WorldWideMarkets Community Blog features several such analysts whose market opinions are shared within the trading community as a means of education and increasing awareness of how to identify and act on trading opportunities.
This is made possible by using currency trading charts explained with trends that have been identified in order to determine where support and resistance levels exists, whether on a horizontal scale (fixed to price levels), or on ascending and descending diagonal scale (not fixed to prices).
Factors that Affect Market Conditions and Currency Trading Charts
The degrees of Supply and Demand and the ratio of one to the other is at the heart of nearly every economic system that is operated freely and thus has a natural effect on prices leading to an efficient market which thanks to increasingly complex methods and technology, continues to evolve.
In addition to applying inter-market and intra-market analysis and interpreting the effects of geo-political and fundamental economic news, numerous approaches to analyzing financial market behavior exist, in order to best plan for current and future participation.
For example, in foreign exchange, local and global regulations, or Forex law, or the lack-thereof across various jurisdictions can affect how the markets in those regions operate.
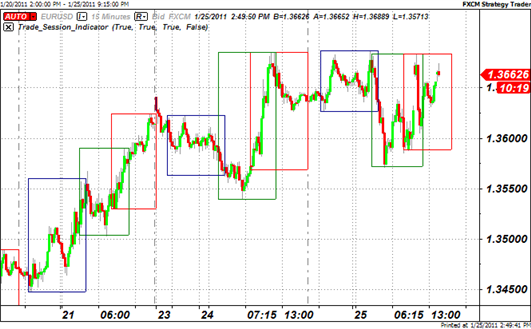
Nonetheless, regardless of regulatory developments, changes in technology or the markets structure, using a basic currency trading chart can show the price history of a trading instrument, as seen below in the example charts, and provide a basis for technical and/or fundamental analysis.
Example Currency Trading Charts Explained
Using the recent spot forex rate price history of the Euro Currency (EUR) versus the United States Dollar (USD), known as the EUR/USD currency pair, below are examples of different chart types within the AlphaTrader platform available from WorldWideMarkets.com:


