Common Chart Patterns
Post on: 10 Июнь, 2015 No Comment

By forexnews on Sep 2, 2011 03:45:48 GMT
We are pleased to introduce the following series of articles that will discuss various aspects of the forex market, with the use of technical analysis (chart reading) and fundamental analysis (economic data). We will begin with simple concepts and move to more advanced areas of interest over time. Our goal is to apply these lessons to current market conditions so that we may anticipate future probable market conditions and the appropriate trades. We sincerely appreciate any comments / feedback. We wish you the very best of luck in all your trading endeavors.
Adam Rosen.
-9/1/2011
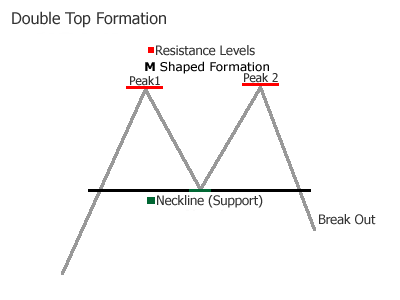
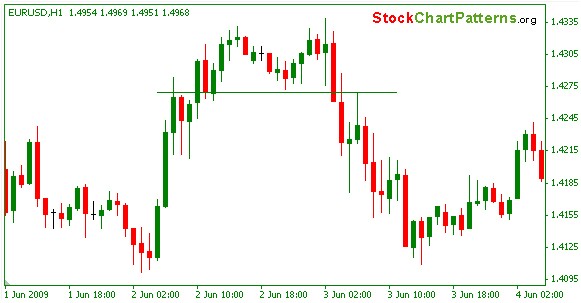
One of the most commonly used forms of technical analysis is the study of patterns that emerge on long and short-term charts. These chart patterns are typically constructed through the use of trend-lines. Support is drawn by connecting at least 2-significant low points on the chart while Resistance is drawn by connecting at least 2-significant highs. The resulting pattern can tell us a lot about the market’s trend and direction and ultimately the likelihood of future prices.
A Trending Channel occurs when either the buyers or sellers are able to impose a significant amount of influence causing the market to accomplish new highs or new lows over a given period of time. In an up-trending market support should be drawn first, while in a downtrend, resistance should be the primary line. However often times the support and resistance lines will emerge in a parallel fashion providing us with an extra level of confirmation that we have in fact drawn the chart correctly. In the following (down) trend, traders opt to enter a position to sell-short due to the fact that the long-term direction is to the downside. These trades should be opened as close as possible to resistance with protective stops placed above resistance at a point on the chart where we believe ‘the market should not test’. In an up-trending channel, only orders to buy should be placed, as close as possible to support.
When neither the buyers nor the sellers have a dominant force in the market, range-bound patterns typically occur. Often times these range bound markets take the shape of a Triangle consolidation pattern. Support and resistance are drawn in the same fashion by connecting significant highs and lows, but the difference lies in the trade selection. Due to the fact that the market does not indicate a direction, traders may utilize a simple ‘buy low, sell high’ approach, with the expectation the market will not break out of this pattern but rather return towards the center.

Another chart variation known as a Flag & Pennant occurs when the market enjoys a fast move either to the upside or downside and is followed by a near horizontal consolidation pattern. During the period of consolidation, traders may also utilize a ‘buy low, sell high’ approach as in the aforementioned triangle pattern, however it is important to note that Flag & Pennant patterns are known to eventually ‘breakout’ in the same direction as the underlying trend, in this case to the upside. Within every chart pattern, traders should always make note of the longer-term trend and this is holds true in Flag & Pennants. Traders with a longer-term outlook may choose to initiate a position within the ‘pennant’ with the anticipation of an eventual breakout, in the same direction as the overall trend and preceding ‘flag’.
A somewhat more complex but equally common pattern is known as the head and shoulders . This pattern is basically a ‘triple top’, where the center high point extends higher than the first or third. The pattern begins as the market establishes a significant high (1 st shoulder) and then retraces to a degree. During the market’s second rally, higher highs are achieved (head) as the market subsequently returns back to the downside. The pattern is then verified as the market rallies a third time, but is unable to retest the previous highs (of the head) and usually comes very close to the highs of the first shoulder. Drawing a horizontal (or sometimes diagonal) line connecting the highs of the two shoulders establishes the ‘neckline’. As head and shoulder patterns are known to be indicators of a market reversal, traders may opt to ‘sell-short’ near the highs of the second shoulder, with protective stops placed near the highs of the head. This pattern may also occur in an inverse fashion where the head rests at the bottom of the chart, and is referred to as an ‘inverse or upside down’ head and shoulders.
In short, chart patterns are used to frame the market’s trading activity into discernable patterns that are easily recognized. They simply illustrate the tendency of the market and the trend and direction if any. To increase the accuracy of trades placed, chart patterns can be used in conjunction with an oscillator indicator that measures the relative strength of the market, such as the RSI, MACD, or Stochastic indicator. Of course there are many other important aspects to speculating in the financial markets such as managing risk as well as the analysis of the underlying fundamental forces, which drive a market. But chart patterns can be easily applied to serve the novice to advanced trader.
We wish you the best of luck with all your trading endeavors.


