Commodity Channel Index (CCI)_2
Post on: 16 Март, 2015 No Comment

Q. What are Trading Channels or Bands?
A: These are basically two parallel lines drawn to the moving average, one aboe and one below designed to show up to 90% to 95% of the underlying action. Channels helps a trader time his entry points and reduces the risk of taking the right trade and being stopped out only to see the market temporarily retracing (assuming you go long) only for the market to continue its upward trend. They are useful in illustrating the price range of a share and provide a snapshot of the average market bullishness/bearishness. Should prices move out of the range, it can suggest market euphoria or a picture of doom and gloom. In such circumstances it is wise not to follow the crowd or if the vertical distance between the two channel lines is large enough, one can even consider a higher risk contra-trend trade.
Even within longer term trends there are likely to be corrections which will test the main trend line and thus one can even draw steeper sloping, shorter trendlines that can be drawn within the major channel. A break of these minor lines can mean that a trend reversal or a breakout is likely which will open new trading opportunities. Timing is important here as capturing a move from one equilibrium state to another is key to making quick profitable trades. Such breakouts usually happen when a share moves up through a level of previous strong resistance (or down through support) and these moves usually come with a considerable increase in volume reflecting increased demand as other market participants see the opportunity and dive in. That resistance or support might follow from the neckline of a top or bottom turning point pattern, a trendline or even a moving average, all of which can considered to having been influencing the market and then all of a sudden they are unable to restrain the share price.
Q. Any recommendations for reading the CCI (Commodity Channel Index)?
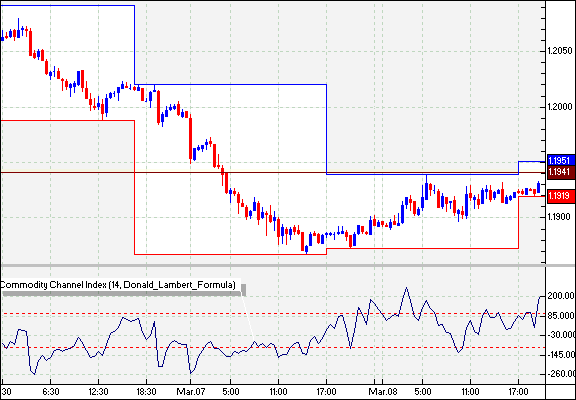
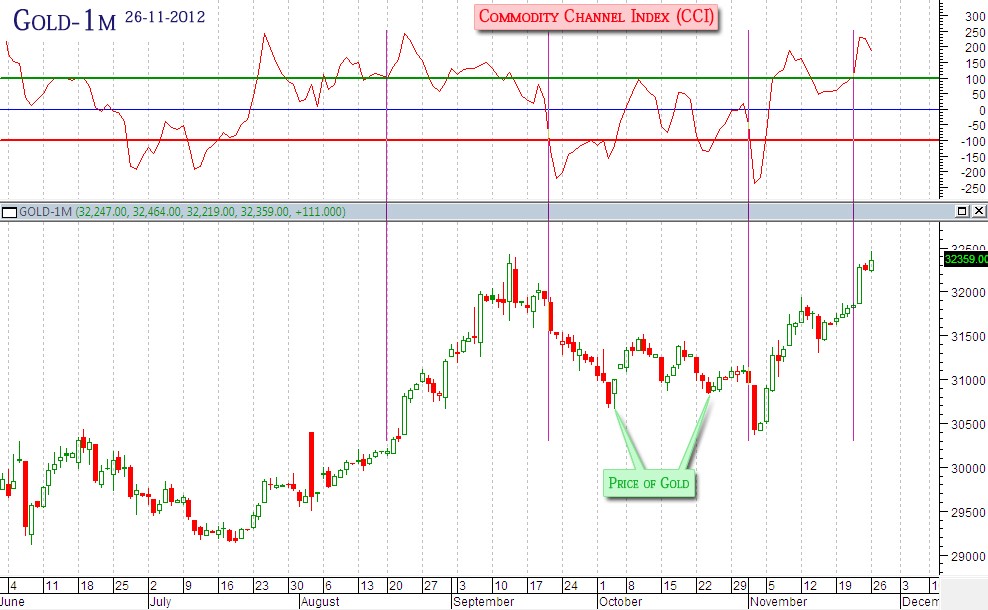
A: The CCI (Commodity Channel Index) is an indicator employed by technical chartists to analyse whether a) a price is likely to change direction b) if a financial asset is overbought/oversold. To help you predict a price reversal you can compare the direction trendlines for the price and the Commodity Channel Index. Should the direction of the market trend line be different to the direction of the CCI trend line, a price reversal might be on the cards. Having said that, CCI is widely used to check for overbought and oversold conditions. A share is considered overbought when it nears 100% or higher, and oversold when it is -100% or lower.
I’m mostly self taught, trial and error on intraday trading. I seem to remember some good stuff on Barchart.com I think it was > education > CCI (Commoditiy Channel Index Indicator). Don’t sign up to any paying web site. The biggest CCI site I’m told is a scam — Woodies CCI. Most text talk of using short periods 5 — 20 but they don’t work.
In practice the CCI shows the difference between a share’s current price and its average price. So a high value indicates that the current price is much higher than its usual level and a low value shows that the price is far below its usual level. This can therefore be used as an overbought/oversold indicator where typically, readings above +100 imply the share is overbought and a value below -100 implies it is oversold.

For myself a few years ago I found someone on the trade2win BB who used longer periods on RSI so I tried it on CCI and it seemed to find trends. I have stuck with it since and discovered several little quirks on +ive and -ive divergence and a recent one today called hidden divergence. Trend lines, support/resistance and filters for reducing false breaks. Just a case of playing around with the settings as you would with moving averages. Eventually you find settings that suit your individual risk profile. You can also get very similar results with RSI and moving averages. The whole thing is still evolving. I have recently read a blog that claims to have back tested every indicator using Trade Station software. The writer is vastly experienced and found that no indicator would make profits if used as a standalone trading indicator. Learning when not to take a trade is where the money is made imo. I study the losing trades far more than the winners. I then look for things that might have prevented the loss.
Note: CCI (Commodity Channel Index) is a trend following strategy. It will not predict a future trend, only the price breakout does that so CCI must be used in conjunction with a price breakout. Some technical analysts do however use CCI with the premise that an overbought signal precedes an asset price drop, and that an oversold signal precedes a price rise.
Practical Application of CCI:
Example by experienced chartist Henry: The strategy is three CCI charts for end of day and two CCI charts for intraday. 26 period and 60 period for intraday plus 200 period for end of day. A buy signal is a price breakout with CCI breaking above +100 line. A sell signal is a price breakout with CCI breaking -100 line. A trade closes with a break back over the CCI zero line. Money management; scale in with a position as each CCI chart breaks +100 line and scale out as each CCI breaks zero line. This is especially good for bluechips that can follow a trend on the 200 period chart for several years. Alternatively buy with one larger position and scale out and back in as things progress. The CCi chart works well with trend lines drawn on it and shows up price divergences similar to macd. Its advantage over macd especially intraday is that at the end of the trend the CCI can be used in its original form as an overbought/oversold indicator for trading the ranging market. I have built the strategy around myself so I appreciate that its not for everyone.


