Charts and Quotes (learn forex online)
Post on: 11 Октябрь, 2016 No Comment

Why Charts and Quotes?
Charts and quotes are the language of forex prices. Expertise in reading charts and understanding quotes is a valuable—even essential—weapon in the successful forex trader’s arsenal. Effectively reading charts and quotes requires being familiar with numbers and decimal places and basic math principles like addition and subtraction, multiplication and division. To being exploration of charts and quotes, let’s review some basic information covered in previous sections.
Currency Pairs, Base currency & Quote currency
In forex trading, a trader buys one currency at the same time he sells another, or vice versa. The two currencies are commonly called a currency pair. Both currencies are listed together so the trader can know exactly what value is placed on the currency bought and the currency sold. For example as USD/CAD quote might be displayed as 1.0438/41. In this example the first currency, the United States dollar, is called the base currency and the second, the Canadian Dollar is the quote currency.
For many currency pairs, the U.S. Dollar is used as the base currency, reflecting in this case the value of the CAD (the quote currency) in relation to 1 USD. This example indicates that 1 USD can buy 1.0438 Canadian Dollars, or that it takes $1.0438 Canadian Dollars to purchase 1 US Dollar.
Not all currency pairs use the USD as the base currency. For example, when the Euro was introduced in 1999, the government of the European Union decreed that all foreign exchange quotes using the Euro would place the value of the Euro first. Therefore, quotes involving the Euro would read as follows: EUR/USD 1.4545, meaning that one Euro will buy 1.4545 USD. Two other notable currencies are listed as the base currency in all quotes, even against the USD; the Great Britain Pound (GBP), and the Australian Dollar (AUD). In some cases, neither the USD nor the EUR are found in the base currency or quote currency. Such currency pairs are called cross rates. An example of a cross rate is CAD/JPY (Canadian Dollar/Japanese Yen). (Note that definitions of the term cross rate vary. Some rely upon the context of the county in which the term is used — seemingly an arbitrary definition in a global marketplace.)
Bid/Offer and Ask, Spreads
In any forex transaction, one currency is sold at the same time another is bought. Just as in an auction, the foreign exchange market uses the terms Bid and Ask to describe the value of the currency. The difference between the Bid and the Ask, also known as the spread, is used to calculate the amount of profit or loss on the trade.
Forex rates are often stated with both Bid and Ask included together, separated by a slash:
For example the term USD/CAD 1.0438/41 indicates that the bid price for USD/CAD is 1.0438, the ask price is 1.0441, and the spread is therefore 0.0003, or of 3 pips.
Remember: the Ask is the price at which a Trader might purchase the currency pair, while the Bid is the price at which a Trade might sell the same pair. The Bid is almost always lower than the Ask price, except in unusual conditions seldom (if ever) experienced by the speculator
As an example of how the quote prices relate to trading, consider the following:
Assume that the current price of United States Dollars when compared to Canadian Dollars is USD/CAD 1.1000/03 (the Bid is 1.1000 and the Ask is 1.1003, and the spread is 0.0003, or 3 pips. At those rates, a trader wanting to buy one USD would pay 1.1003 CAD, while he could sell one USD for 1.1000 CAD. To put this in practical forex-trading terms, a trader wanting to buy 100,000 USD would require $110,030 CAD, while 100,000 USD could be sold for $110,000 CAD.
If the trader purchases USD/CAD at those rates, and then trader waits until the forex price quote rises to USD/CAD 1.1006/09, he could sell his USD/CAD position for $110,060 CAD earning a profit of $60.00 CAD.
However, if the price for the USD/CAD does not change in the time the trader holds the position, and the traders sells the USD at the same price 1.1000/03, the position would be sold for $110,000.00 CAD, creating a loss of $30.00 (the amount of the spread).
What is a pip? What is it worth?

Profits, losses and spreads in forex trading are often expressed as pips. A pip is the smallest unit of price for any currency. It is short for Percentage in Point. In forex trading, currency values are usually stated very precisely, to the fourth decimal point. A pip is the smallest change in the fourth decimal place, or 0.0001. For example, for USD, a pip is 1/100th of a cent. The Japanese Yen is the only currency expressed to the second decimal place, making a pip 0.01 in this case.
Forex Charts and Technical Analysis
forex.tradingcharts.com/chart/ .
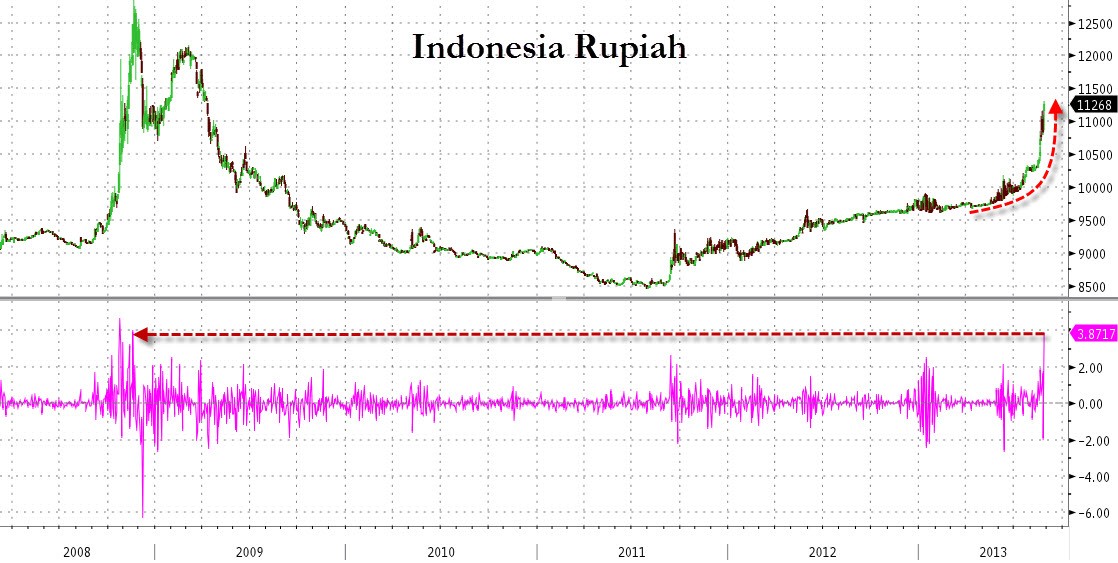
Charts are used extensively by traders, to study past patterns of price movement, identify ongoing trends, and to try to forecast future price movement. Technical indicators are often used in conjunction with charts. Simple technical indicators include moving averages. Many complex indicators are available, which involve complex mathematical analysis of price data. Fortunately, online charts do all the calculations automatically, and display the results as overlays on the chart.
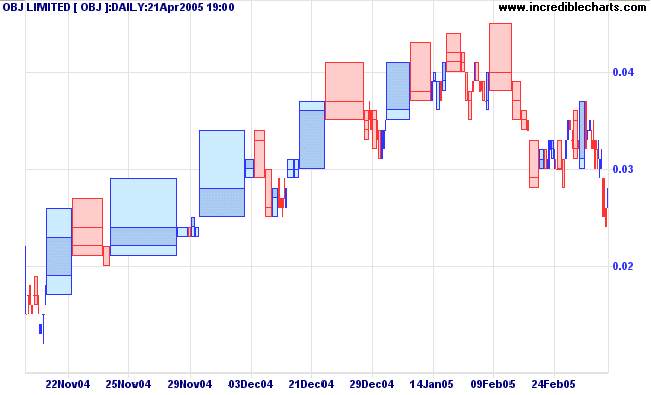
Forex charts are usually presented in one of several formats, including line, bar chart and candlestick.
Technical Analysis
Technical Analysis goes hand-in-hand with forex charting. Technical analysis attempts to forecast future price movement through the mathematical analysis of past price action. Various simple tools can be used in technical analysis, such as moving averages, trend lines and support levels, or the advanced trader might choose from a wide range of advanced analyses and theories including relative strength index, Fibonacci studies, cycles, and more.
For more information about charts and technical analysis, see the section Fundamental and Technical Analysis.


