Chart Analysis and Forex Trading With HeikinAshi Candlesticks
Post on: 10 ąÉą┐čĆąĄą╗čī, 2015 No Comment

Categorized | Forex Strategy. Heikin-ashi. Indicators
Chart Analysis and Trading With Heikin-Ashi Candlesticks Indicator
Posted on 10 May 2012 by Admin
Heikin-ashi technique
Heikin-ashi is a charting technique that creates candlestick charts similar to the traditional Japanese candles. Charts constructed with the heikin-ashi method have ŌĆ£more balancedŌĆØ candles and enable traders to identify trends more easily.
Heikin-ashi chart looks like standard candlestick chart, but with lots of noise removed and with much less irregularities, preventing traders from taking many of the false signals.
This is achieved using different method of calculating and plotting candles on the chart.
How is heikin-ashi chart constructed
Each candlestick in the traditional candlestick chart is defined with the four different values: Open, Close, High and Low price. When the candle is drawn, next one is independent and has no any correlation with the previous candles.
Heikin-ashi technique calculates Open, Close, High and Low price for the current candle using some information from the previous candle:┬Ā
- Close price in a heikin-ashi candle is the average of open, close, high and low price of the current standard candle
- Open price in a heikin-ashi candle is the average of open and close from the previous heikin-ashi candle
- High price in a heikin-ashi candle is the highest value chosen from the high price of the current standard candle and open and close price of the current heikin-ashi candle.
- Low price in a heikin-ashi candle is the lowest value chosen from the low price of the current standard candle and open and close price of the current heikin-ashi candle

How does heikin-ashi chart looks like
Candles in the heikin-ashi charts are related to each other. First thing to notice is that each candle always opens in the middle of the previous candle body. High and low prices are depending on open price, so it makes them too dependant on the previous heikin-ashi candle.
This makes heikin-ashi chart a bit similar to a moving average.
Lets see how the heikin-ashi chart looks like compared to the candlestick chart. Below are two EUR/USD charts for the same period of time, first shows standard Japanese candlestick chart and second is heiken-ashi chart for the same period.
EUR/USD Japanese Candles Chart
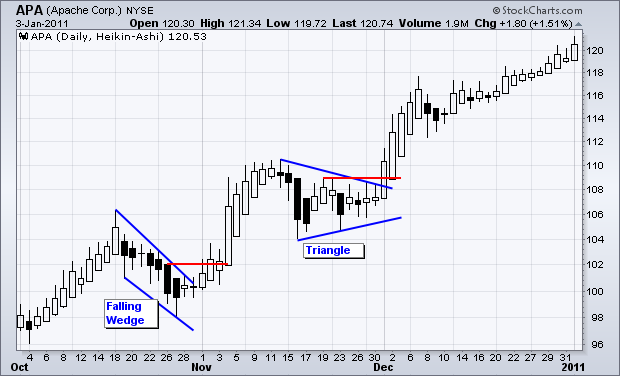
EUR/USD heikin-ashi chart
How to read signals on heikin-ashi chart
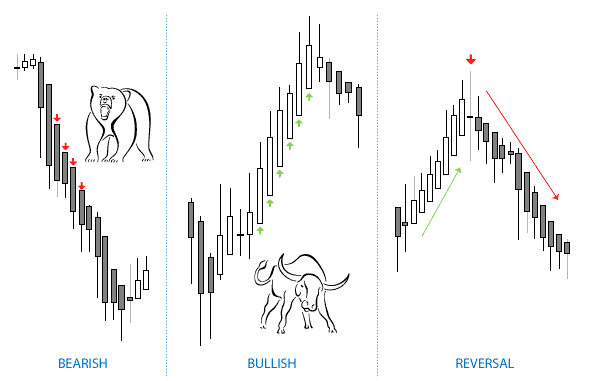
There are five important patterns on the heikin-ashi chart that trader should be able to recognize:
- Normal trend
- Uptrend is identified with raising white bodies
- Downtrend is identified with falling red bodies
- Very strong trend
- Uptrend is identified with long white bodies without down shadow
- Downtrend is identified with long red bodies without upper shadow
- Trend weakening
- Uptrend white bodies are shortening and lower shadows are emerging
- Downtrend red bodies are shortening and upper shadows are emerging
- Consolidation
- Smaller white bodies with both upper and lower shadows
- Smaller red bodies with both upper and lower shadows
- Change of trend
- Uptrend will probably when there is a very small white body with long upper and lower shadows
- Downtrend will probably change when there is a very small red body with long upper and lower shadows
White and red bodies are used for drawing bullish and bearish candles in the heikin-ashi indicator that comes with Metatrader 4 trading platform. Depending on your platform or indicator settings, colors can be different. In the above description, white bodies represent bullish trend, while red bodies represent bearish trend.
Heikin-ashi signal examples
Normal uptrend, reversal and strong downtrend:
Heikin-ashi patterns example: consolidation and strong downtrend


