Candlesticks Light The Way To Logical Trading
Post on: 10 Апрель, 2015 No Comment

Error creating thumbnail
An example of how the Morning Star and Evening Star look like
A Morning Star formation is a bullish reversal signal for an overall downtrend. The first candle should be strongly negative and full-bodied, reflecting heavy losses. The second candle opens at or below the previous close, trading within a relatively narrow range with the high staying below the midpoint of the first candle. The third candle is strongly positive and closes above the midpoint of the first candle. This tells us that bearish sentiment is unable to push price below previous lows, and risks remain for a reversal in price trends.
Error creating thumbnail
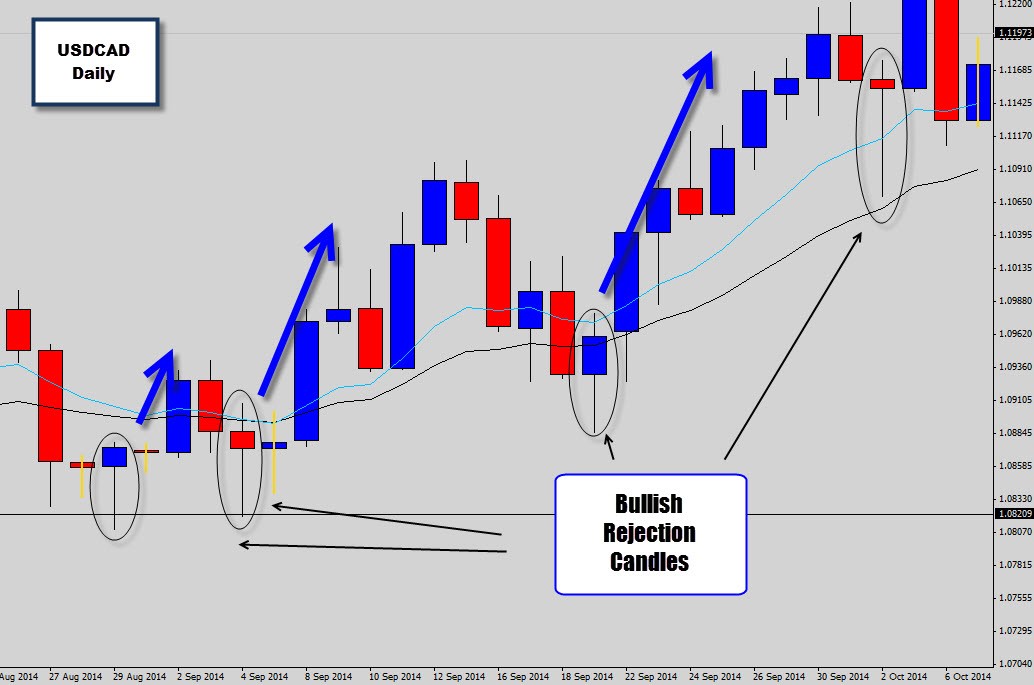
An example of how the Hammer formation and Shooting Star Formation look like
A Hammer forms when price is in a downtrend and price trades sharply lower from the open, but a subsequent reversal leaves price marginally unchanged through the close. The candlestick formation is distinct for its long wick to the downside, small candle body, and little or no wick to the topside—signaling that price finished near the top of its intra-candle range. It is a decidedly bullish formation, as it tells us that bulls have overpowered an initial bearish tumble.
A Shooting Star formation is effectively the exact opposite of the Hammer. Price remains in an uptrend when it opens and trades sharply higher within a given candle, but a subsequent reversal leaves it near or below its candle open. The Shooting Star is distinctive for its very long, upward wick, small candle body, and little to no wick to the downside. The formation signals that a bullish run was initially enough to push price to new highs, but exhaustion has allowed bears to push price significantly lower before the candle’s close.
How to Trade Forex Using Candlesticks
The key to using candlesticks when trading in the forex markets is to keep technical levels in mind, particularly with the four candlestick patterns we’ve discussed. Indeed, the likelihood of accurately interpreting the candlestick signals increases dramatically when you take into account key support and resistance levels. For example, if a trader is watching the EUR/USD pair and anticipates a potential change in trend, chances are they will be waiting for price to approach a significant trendline orFibonacci level. By watching the candlestick patterns, the trader simply has an additional tool by which to more confidently call for a turn. When employing candlestick patterns, it is important to utilize the rules of money management. A trader can do this by using fairly tight stop-loss orders. If the currency pair that is being traded does not follow the direction that the candlestick pattern signals it should, chances are it won’t at all. As a result of placing a stop- loss order, the trader can avoid being caught on the wrong side of the position if the pair breaks out and thus, can limit their losses.


