Candlestick Signals and Today’s Technical Analysis An Accurate Combination
Post on: 16 Март, 2015 No Comment

Candlestick Signals and Today’s Technical Analysis, An Accurate Combination
Stephen W. Bigalow
11 Aug, 2005
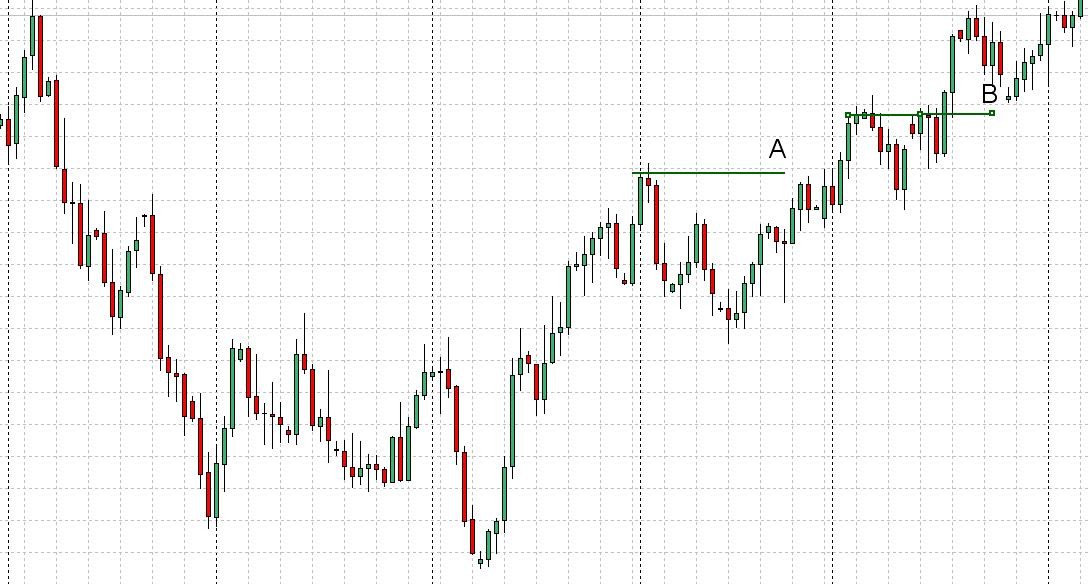
One of the basic results discovered in the research is when a trend breaches a moving average, comes back to test it and fails, it will test the next moving average and/or breach the recent lows of the current trend. Note the signals in the ENI chart. The signals occur very close to the moving averages, the 50 day and 200 day. Point A illustrates a spinning top. a long legged doji. and a couple days later a harami that was confirmed with a gap down in trading the next day. All these indecision and bearish signals were occurring right at the 50 day moving average.
The candlestick signals revealed a failure of the trend to move up through the 50 day moving average. From that point, the trend moves down to the 200 day moving average. Notice that prior to Point B, the stochastics had moved into the oversold area. However, it was the appearance of the Candlestick buy signals right at the 200 day moving average that produced the trend reversal. The appearance of the Inverted Hammer signal and two Hammer signals was the clear indication that they were not able to keep prices down below the 200 day moving average. The gap up following those signals visibly indicated that the bottom had been established at the level. Then the trend moved right back up to the 50 day moving average. At Point C, the uptrend stopped right at the 50 day moving average again with the formation of a Bearish Engulfing signal. A few days later, after one more attempt to get up through the 50 day MA, a Morning Star signal, and double top confirmed the selling pressure again right at the 50 day MA. From that area, the prices when down and breached the recent lows.
For the swing trader. the signals, in combination with the moving averages create highly accurate trades lasting 3 to 15 trading days. For the longer term investor, the analysis can be applied to the indices. Having a platform for establishing long and short positioning greatly enhances the profit probabilities. Common sense portfolio strategies can be put in place by evaluating the direction of the market indexes and then scanning for the signals in individual sector s/stock s that correlate with the index trends. The moving averages provide the support and resistance levels while the Candlestick signals confirm what is happening to investor sentiment at those levels.

Note how the trading becomes indecisive in the moving average area on the Dow chart. These periods reveal numerous candlestick signals while the stochastics are in the oversold or overbought conditions.
A major advantage of combining candlestick signal confirmation with the moving averages is intra-day trading. When fast, decisive trade decisions are required to maximize trade potentials, the combination of the signals at the moving averages perform very well on the one minute, five minute and fifteen minute charts.


