Candlestick Chart The Stock Charting Edge
Post on: 9 Апрель, 2015 No Comment

This type of chart is a specialized category of technical analysis. A candlestick chart is used to describe price movements in financial instruments like stocks, commodities, forex, or any publicly traded financial instrument. It was invented by the Japanese in the early 16th century by Japanese rice traders. Steve Nison is the Candlestick Authority Steve is responsible for introducing this form of technical analysis to the west, and has published many best selling books on the subject. He teaches traders how to use a candlestick chart to exploit stock trading opportunities. Steve Nisonss website has everything you need to become an expert in candlesticks.
Other Resources
Breakout Theory Trading System
Stock Charts & Scanning Services
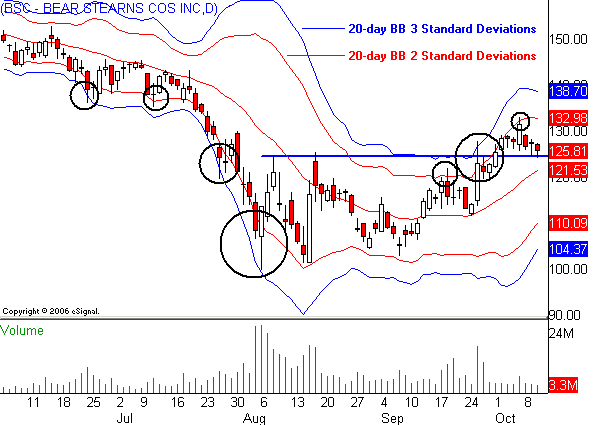
The Candlestick Chart is the Industry Standard (pic above) ALL CHARTS ON THE INTERNET ARE IN CANDLESTICK FORM. Many of todays top traders and analysts swear by this form of technical analysis, and most stock trading platforms today have the candlestick chart as a default view setting.
Accurate Forecasting Capabilities The candlestick chart can help you identify trend reversals, market tops, and indications of buying and selling activity. All of our charts, and most traders charts are in candlestick form. It is a necessary tool in the stock traders arsenal of knowledge. Experienced stock traders have at least a basic understanding of the candlestick chart. Even the slightest knowledge of candlesticks can improve your trading and enhance understanding of price action in the markets.
Parts of a Candlestick Chart Explained: The candlestick consist of the body (black or white), and an upper and a lower shadow (wick): the area between the open and the close is called the real body. price excursions above and below the real body are called shadows. The wick illustrates the highest and lowest traded prices of a security during the time interval represented. The body illustrates the opening and closing trades. If the security closed higher than it opened, the body is white or unfilled, with the opening price at the bottom of the body and the closing price at the top. If the security closed lower than it opened, the body is black, with the opening price at the top and the closing price at the bottom. A candlestick need not have either a body or a wick.
To better highlight price movements, modern candlestick charts (especially those displayed digitally) often replace the black or white of the candlestick body with colors such as red (for a lower closing) and blue or green (for a higher closing).
Other Resources:
The Candlestick Summit Live Seminar Candlestick charting is a sophisticated and very deep analytical method for understanding the financial markets. Many traders have found that specializing in candlestick charting, has enhanced their trading skills. Youll notice that many of the traders charts are all in candlestick form. If you would like to gain specialized knowledge in this form of technical analysis, Steve Nison offers educational packages. Check out the Summit Link below.


