Bollinger Bands Basics Currency Trading Indicators
Post on: 4 Июль, 2015 No Comment

Bollinger Bands Basics
Standard Deviation of Price
Standard deviation gives an indication of the volatility of any price, it measuring how widely the current price is dispersed from the average price. Dispersion is the difference between the actual current price and the average value. The bigger the difference between the current price and the average price, the higher the standard deviation or volatility of the market studied will be.
Understanding Volatility
In any financial market including FX, the value of the market tends to rise slowly over the longer term. Prices may become volatile in the short term, but short term price spikes away from the average are short lived and will normally come back to longer term moving average. Greed and fear cause short term price spikes and when they come volatility increases and you can see how volatile the market is by looking at Bollinger Bands.
Bollinger Bands Calculation
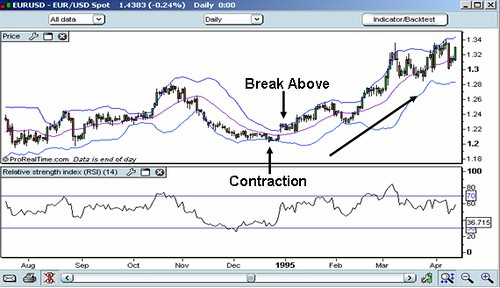
Bollinger bands consists of a centre band and two outer bands; the centre band is normally a 20-day simple moving average, the upper band is the 20-day simple moving average plus 2 standard deviations and the lower is a 20-day simple moving average less 2 standard deviations.
Of course when price volatility is low the bands are close together, when volatility is high the bands expand and widen away from the average. By looking at a chart and overlaying the Bollinger Band, you see the standard deviation or volatility of price in historical terms.
Using Bollinger Bands
Below are three common uses for Bollinger Bands which you can incorporate in your currency trading strategy. Always keep in mind you need to combine this indicator, with others to generate trading signals, as Bollinger Bands, simply alert you to the opportunity.
Low to High Volatility
When a currency pair trades in a narrow range, the Bollinger bands will be narrow and close to the central moving average however low volatility doesn’t last and when prices break above or below the upper or lower band, you have a warning sign that a new trend could develop.
Getting into Trends
When a trend has started simply look for a dip toward the centre band and enter in the direction of the trend Which represents fair value.
Swing Trading and Trend Changes
When the price touch the top or bottom of the Bollinger band on high volatility, the swing trader will look to get in with his currency trading system and the contrary trader looking for a trend change, will also be looking to trade the move.
Bollinger Bands an Essential Forex Trading Indicator
If you don’t understand volatility, you won’t maximize the profits from your currency trading strategy so you should make a study of standard deviation of price and the Bollinger Band part of your essential currency trading education today.


