Bollinger Bands
Post on: 2 Август, 2015 No Comment

Introduction
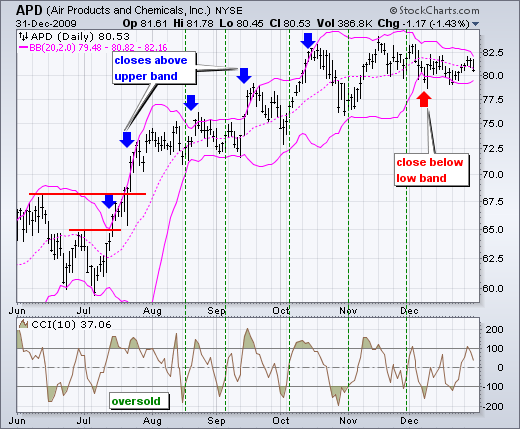
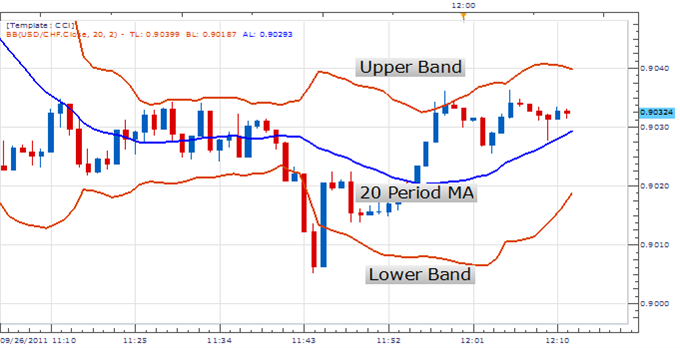
Bollinger Bands is one of the very commonly used technical analysis indicators and is quite useful in knowing the levels where the price action may reverse in the ranging markets. Bollinger Bands indicator was developed by John Bollinger and is a registered trademark of him. Bollinger bands gauges the volatility of the market and compare those with the average prices. It consists of 3 lines or bands. The center band represents the moving average of the price action. The other two bands are on the either side i.e. above the center band and below it. The upper band represents the volatility towards the highs of the price action and the lower band represents the volatility on the lows.
As a simple explanation we can say that the lower and upper bands represent the upper and lower trading ranges
As seen in the above chart for EUR/USD, the Bollinger Bands is a set of three blue dotted lines and look like flowing stream.
At the first glance it would seem as if when the price action touches the upper band, it tends to move down towards the lower band and vice versa. This is how the Bollinger Bands are used to predict when to enter and when to exit a tread position. But please note that these buying and selling trading signals are only good when the price action is in range i.e. running sideways and not trending in one direction.
Calculation
The upper and lower bands are based on the calculation of standard deviation.
Let’s assume that we are working on Bollinger bands based on 14 periods then the calculation will be as follows:
- Middle Band = Simple moving average for 14 periods.
- Upper Band = Middle band + (2 x standard deviations for 14 periods).
- Lower Band = Middle band (2 x standard deviations for 14 periods).
Calculation for standard deviation
Let’s assume that we are working with Bollinger bands for 14 periods then the standard deviation will be calculated as follows:
- Calculate the simple moving average for 14 periods.
- Calculate the deviation for each 14 periods. Deviation for a period =. closing price for that period — simple moving average for 14 periods. The value we get will be positive if the closing price is more than the moving average and negative if the closing price is less than the moving average.
- Square the deviation of each period. By squaring any negative values will become positive.
- Add all the squared deviations for the 14 periods. Say the sum = D.
- Divide the sum of the squared deviation by the number of periods i.e. D/14. Basically what we have done is calculated the average of the squared deviations for all the periods. Let’s say (D/14) = N
- Calculate the square root of the above i.e. square root of (D/14). This is the standard deviation for the 14 periods.
- If we analyze this calculation we would observe that we had take the square of all the values and then at the end we had calculated the square root, hence the purpose of calculating the squares was just to convert any negative values into positive values. The standard deviation is always a positive value.
Trading with Bollinger Bands
Bollinger Bands can be used for trading in following ways:
1) Sideways price action

When the price action is in range then the price generally moves between the upper and the lower bands. Once the price action hits the upper band, it is an indication that it may move down towards the lower band and vice versa. Please not that this cannot be classified as a signal but just as an indication. During the trends the price may keep hitting the bands and bands would keep slopping upwards or downwards with the uptrend and downtrend respectively.
If we analyze the following chart, it would be clear as to what would have happened if entries or exits were made during the sideways price action (points A,B,C,D) and during the trends e.g. point X and Y.
Please refer the above chart for the following points:
- If we had short sold the pair at A (when price touched Upper band) then we could have made profits by covering the trade when the lower band was touched at B.
- If we had bought at B (when price touched Lower Band) then we could have made profits by covering the trade when the it touched the Upper Band at C but please note that if we would have entered a long position at point B there was a high probability that our position would have met the stop-loss before moving towards the profit target.
2) During the Trend
If we short sold EUR/USD at X (when price touched Upper band) and waited for it to touch the lower Band to take profits, we would be in loss as it never went down to touch the lower band. Same with point Y and so on.
Considering the above points it is recommended that that we should not consider the band-hitting as a trading signal as it may prove to be quite risky.
Trading strategies
- When the market is moving in range (sideways movement): We can buy when the price touches the lower band or goes outside of the bottom band and close the position when the price touches the moving average i.e. the middle band.
- When the market is moving in range (sideways movement): We can short sell when the price touches the upper band or goes outside of the upper band and close the position when the price touches the moving average i.e. the middle band.
Other Trading Strategies
Breakout:
When the price action is in a range and the range starts getting narrower, it may be a sign for a break out. The breakout can be on either side and we can enter the market in the direction of the breakout.
W formation
The concept is same as the double bottom chart pattern formation but the following points cover the way it is considered as a signal:
- During a downtrend the price-action hits the lower band or tries to break below it but gets support.
- With the above mentioned support, the price retraces towards the middle band or even above it, however, it fails to touch the upper band and falls.
- The fall takes the price to a level lower than the previous low, however, the price-action fails to touch the lower band and moves up again. Please note that any brief spike may be there which may touch the lower band but such spikes are only considered as market noises and are ignored.
- Price moves up and breaks above the upper band.
The above pattern indicates a reversal or significant upward consolidation.
M formation
The M formation is exactly opposite to the W formation and is similar to the double top chart formation and is explained as follows:
- During an uptrend the price-action hits the upper band or tries to break above it, but finds resistance.
- With the above mentioned resistance the price retraces towards the middle band or even below it, however, it fails to touch the lower band and jumps up.
- The upward jump takes the price action to a level, slightly, higher than the previous high, however, the price-action fails to touch the upper band and moves down again. Please note that any brief spike may be there which may touch the upper band but such spikes are only considered as market noises and are ignored.
- Price falls again and breaks below the lower band.
The above pattern indicates a reversal or significant downward consolidation.
Period Settings for Bollinger Bands
The quite preferred setting for the Bollinger Bands indicator is 14 periods, which means if we were to calculate on a daily chart we would measure 14 days, and in the case of an hourly chart, we would measure 14 hours. When we apply Bollinger bands on our trading chart the settings would show as Bollinger Bands (14,2). Here the figure 14 represents the number of periods and 2 represents the multiplication factor for the standard deviation as mentioned under the Calculation heading above
We have explained Bollinger Bands in the context of Forex Trading but the same concepts stand good for stock trading or any commodity trading.
Check some Bollinger Bands Trading Strategies with ADX, Stochastic and RSI i.e. using Bollinger Bands in combination of other forex technical analysis indicators. You may also check the overview page of Bollinger bands strategies .
Check some Bollinger Bands videos


