Average Directional Movement Index (ADX) Report
Post on: 16 Март, 2015 No Comment

Ty Young
Hi, this is Ty Young with Surefire-Trading.com and today I will be discussing the Average Directional Movement Index (ADX), which is comprised of the positive Directional Indicator (+DI) and the negative Directional Indicator (-DI).
Limited time only.
In studying these indicators, I found a lot of conflicting data being propagated by ill-advised traders even many of the defining terms had been completely corrupted. As a result, I elected to get my information straight from the horses mouth.
In his book, New Concepts In Technical Trading Systems.
J. Welles Wilder, Jr. states,
Directional movement is the most fascinating concept I have studied. Defining it is a little like chasing the end of a rainbow.you can see it, you know its there, but the closer you get to it the more elusive it becomes. I have probably spent more time studying directional movement than any other concept. Certainly one of my most satisfying achievements was the day I was actually able to reduce this concept to an absolute mathematical equation.
Wilder is a contemporary technical analyst well noted for his accomplishments as the designer of several technical indicators, including the Relative Strength Index (RSI). Although many traders claim the benefits of using the Directional Movement Indicators as stand-alone systems, Wilder developed these indicators to be used as part of a larger system; the ADX and the
+/- DIs were not designed to function as stand-alone systems.
In other words, When the ADX signals a trend, a trend following system is advised. Conversely, if the ADX is signaling no trend a non-trending system is advised.
And frankly, I dont recommend the use of any indicator without additional confirmation. In this lesson we will be confirming the data received from the ADX with the Bollinger Bands and the RSI.
The implications of being able to rate the directional movement of any index, commodity, stock, or currency is staggering. And due to Wilders hard work, we have a product that is nothing short of genius. The process by which Welles developed the necessary equations is complicated and laborious. So, for fear of diminishing the enormity and value of Wilders research, I will attempt to interpret his calculations in such a manner as to simplify his intentions so they may be applied and managed practically.
The calculations for the ADX are incredibly complex the depth of which is beyond the scope of this lesson giving us a great appreciation for our charting software.
But in order to give you a small taste of what is involved with calculating Directional Movement, below is a custom ADX formula that will plot the decimals after the calculation. The built-in indicators plot exactly as Welles Wilder plots them in his book, New Concepts in Technical Trading Systems. These custom indicators calculate the same way save the rounding aspects that Wilder uses.
Periods:=Input(Time Periods,1,100,14);
PlusDM:=If(H>Ref(H,-1) AND L>=Ref(L,-1), H-Ref(H,-1),If(H >Ref(H,-1) AND L
AND H-Ref(H,-1)> Ref(L,-1)-L, H-Ref(H,-1),0));
PlusDI:=100*Wilders(PlusDM,Periods)/ATR(Periods);
MinusDM:=If(LRef(H,-1) AND L
AND H-Ref(H,-1)
MinusDI:=100*Wilders(MinusDM,Periods)/ATR(Periods) ;
DIDif:=Abs(PlusDI-MinusDI);
DISum:=PlusDI+MinusDI;
ADXFinal:=100*Wilders(DIDif/DISum,Periods);
ADXFinal
And this is only part of it, so.
Simply put
the DIs and the ADX are displayed on a scale which has a range of 0 100.
When the +DI is above the -DI, a bullish market is implied. As the Dis cross, giving the -DI top billing, bearish control is implied.
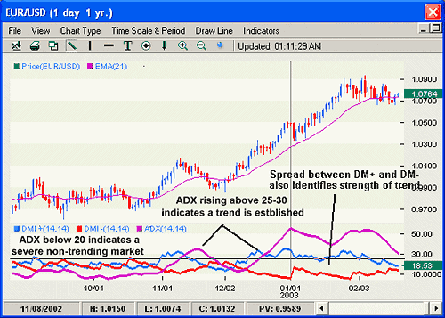
True Directional Movement is the Difference between the +DI14 and the DI14. The more directional the movement of an index (or currency), the greater will be the difference between the DIs; in other words, as seen on a chart, after the DIs cross and their difference increases they begin to pull away from each other (the gap widens), while subsequently, the ADX continues to rise implying a trending market.
In essence, the ADX (Average Directional Index the operative word being Average) is smoothing the action calculated by the DIs.
THE ADX SHOWS US THE STRENGTH OF A TREND. IT DOES NOT TELL US WHICH DIRECTION THE TREND IS MOVING.
The +/- Directional Indicator (DIs) shows us which way the trend is moving.
If the price is criss-crossing in a sideways direction, then the gap would be narrowing implying a non-trending market.
CAUTION
Because, the crossing of the DIs is merely an early warning, Wilder states that the following guidelines should be understood.
Did you catch that?
It is only an early warning signal.
I found many traders advocating a system that encourages entering the market at the crossing of the positive and negative directional indicators
NOT ADVISED
So, with this in mind


