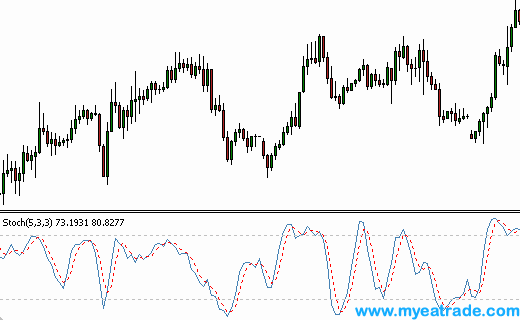
An Introduction to the Stochastic Oscillator Indicator
Post on: 3 Апрель, 2015 No Comment

Building on my last column concerning the value of indicators for foreign exchange (forex) traders, indicators are the result of mathematical calculations done on price data that are displayed on charts. By using indicators, it is possible to anticipate the direction of a price’s movement with a reasonable level of accuracy. However, a word to the wise: no indicator is perfect and no single indicator will be right all of the time.
The Stochastic Oscillator is another popular indicator that is widely used by traders. It is a momentum indicator that gauges support and resistance levels. The underlying premise is that when a price is rising, it tends to close near the high of a recent period, and when it is falling, the price closes near its low. The Stochastic Oscillator actually measures the price relative to the high/low range over a set period of time, thus providing an indication of where the instrument is presently trading within its recent trading range.
The formula for the Stochastic Oscillator (%K line) is:
where:
C = present period’s closing price
Ln = lowest low for the last ‘n’ periods
Hn = highest high for the last ‘n’ periods
n = number of periods used in calculation
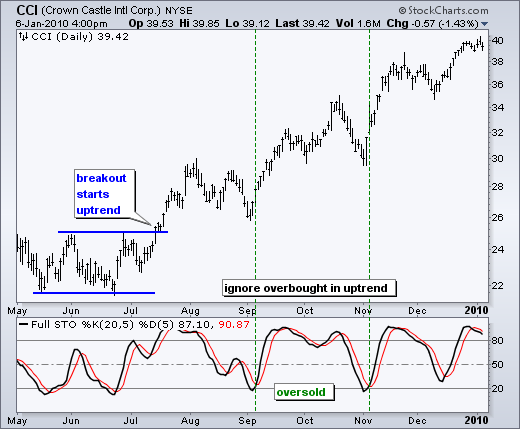
As you will see in the chart below, the Stochastic Oscillator is plotted below the daily chart of the Singapore dollar (USD/SGD) and it consists of two lines.
The Stochastic Oscillator is plotted between the values of zero and 100 and it has reference lines placed at 20 and 80.
It can be interpreted a number of ways. One method is to note when the Stochastic Oscillator crosses the reference lines: when it climbs above 20, this is interpreted as a buy signal, and when it slips down below 80, it is interpreted as a sell signal.

Another way of interpreting the Stochastic Oscillator is to consider readings below 20 to be oversold and readings above 80 to be overbought. Support and resistance can also sometimes be seen in the Stochastic and it may be more evident than on the price chart itself.
The second thinner line in the Stochastic Oscillator is known as the %D line. The %D line is a short moving average of the primary %K line. ‘Crossovers’ between these two lines may provide slightly earlier signals.
The ‘slowing factor’ is another variable that is often used with the Stochastic Oscillator. The average of the closing prices from the last ‘X’ number of periods is used, as opposed to the latest closing price, which helps smooth out the %K line, thereby removing erratic behaviour from the oscillator.
Get a free OANDA demo account to experiment with the Stochastic Oscillator indicator within our award winning fxTrade platform.
Stuart has more than 16 years of trading experience under his belt and specialises in technical market analysis of major currency pairs. Apart from being the author of several bestselling trading books, with his most recently released book Trading in a Nutshell, Stuart contributes to daily newletters and blogs. He also produces articles and videos on the how tos of technical tradings. For more information of Stuart, you can follow him on twitter @stuartmcphee or check him out on Google+.
Please click here for more information about this author.


