An Introduction to Ichimoku Charts in Forex Trading
Post on: 3 Апрель, 2015 No Comment

An Introduction to Ichimoku Charts in Forex Trading 5.00 / 5 (100.00%) 1 vote
The Ichimoku Kinko Hyo, or Ichimoku chart, is a chart used by investors to predict price changes. The Ichimoku was invented in 1968 by a Japanese writer named Goichi Hosoda, which is unusual as most market indicators are created by mathematicians. Utilizing Ichimoku charts is becoming an increasingly popular forecasting strategy on the Foreign Exchange Market (FOREX). Similar to other candlestick charts, the Ichimoku Kinko Hyo implements many data points to provide a more accurate prediction. The following provides an introduction to Ichimoku charts in forex trading.
Ichimoku Charts at a Glance
Ichimoku Charts in Forex Trading
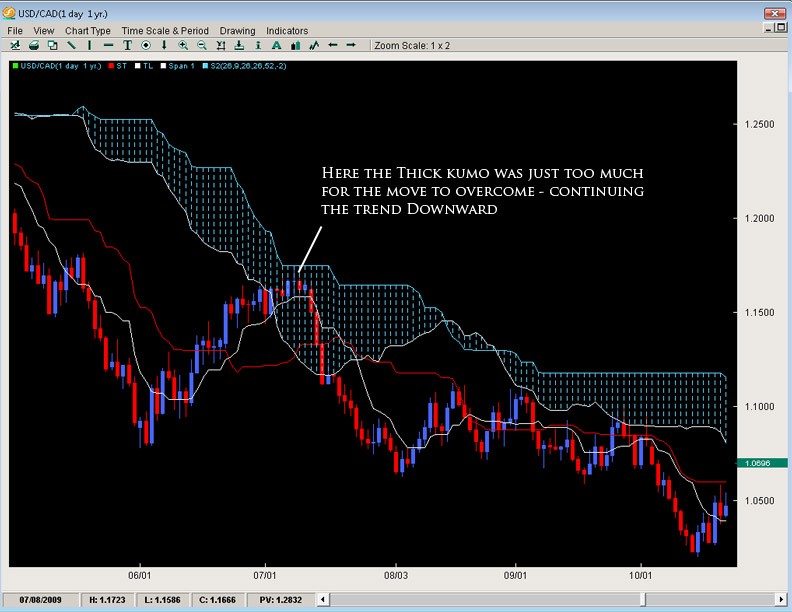
Ichimoku charts are comprised of four main elements. First is the Tenkan Sen, which uses the high and low prices of a stock to calculate the average price. Investors use this moving average to determine the best time to buy and sell stock. More specifically, the Tenkan Sen is determined by calculating the sum of the high and low price of the stock and dividing that number by two. The Tenkan Sen takes into account the last nine time periods. The second component of Ichimoku charts is the Kijun Sen. Similar to a Tenkan Sen, the Kijun Sen divides the highest high and lowest low by two. However, unlike the Kijun Sen, it takes into account the last 26 time periods.
Third is the Senkou Span A. Also knows as the leading span one, the Senkou Span A takes the average value of a Tenkan Sen and Kijun Sen for the 26 time periods ahead of the current one. For each coming time period, a Tenkan Sen and Kijun Sen are added together and then divided by two. Last but not least is the Senkou Span B. This calculation takes the highest of the high and lowest of the low for the past 52 time periods and plots that number 26 time periods ahead.

The space between a Senkou Span A and Senkou Span B is called the Kumo (cloud), with the low line representing the support and high line the resistance. In Forex trading, the term support denotes the point at which the stock price is unlikely to drop below. Resistance, on the other hand, is the point at which the stock price is unlikely to rise above. The adage buy low, sell high applies here. If the stock price is approaching the support price, it probably will not drop lower and the trader should buy. If the stock is approaching the resistance price, the will probably not get much higher and the trader should sell. In general, if the Senkou Span A is above the Senkou span B, markets are bullish; in the reverse scenario, markets are bearish.
An introduction to Ichimoku charts in forex trading is probably insufficient to use effectively use Ichimoku charts. Nevertheless, with a little diligence it is possible to expand on this information to gain an extremely useful and increasingly popular tool to enhance your trading strategy.
Leave a Reply Cancel reply
Your email address will not be published. Required fields are marked *


