ADX The Average Directional Index
Post on: 2 Апрель, 2015 No Comment

Average Directional Index
One of the quandaries that traders will often wrestle with is how strong the trend, if any, may be on the chart.
There are numerous ways of quantifying whether or not the chart is showing an uptrend, or a downtrend; but many of these methods fail in telling us whether what were seeing is actually a trend (or a range that could be potentially detrimental to my trend strategy). Please allow me to explain.
One of the more common indicators used for defining trend is the Moving Average. Traders will often look at the trend being to the side of which price is trading relative to the Moving Average. Below is a chart with one of the more common Moving Averages, the 200 period daily, applied to GBP/USD.
Notice the down-trend on the left side of the chart, and the fact that price is trading below the 200 period SMA at the time. While the strength of the down-trend did take price to lower levels, notice that after hitting a bottom shortly before 2/17/2009 price began to pick up, beginning an elongated move upwards until price crosses up and over the 200 period SMA.
Traders opening short positions on 2/17/2009 based on the Trend (as displayed via the 200 SMA) may have been looking at the rough prospect of this reversal moving against them.
After crossing above the 200 period SMA, price begins to congest in a volatile manner. Traders using the 200 period SMA to identify trends at this point might have a difficult time with long positions, as it appears that the move upwards has stalled.
This is where ADX can help.
The Average Directional Index will not show us whether we are seeing an up-trend or a down-trend, but it can help us see if there is really any trend at all. ADX can be plotted from 0-100 (although readings nearing 100 are rare), and the higher the reading of ADX the stronger the trend that has been seen. Below you will see ADX Applied to the same GBP/USD chart we had looked at previously.
A Horizontal line was added at a reading of 30, on ADX. Many traders will use this as a cut-off, on the indicator; identifying trends as readings of greater than 30, or ranges on readings less than 30.
Notice the bottom of the down-trend (highlighted in Yellow). At the time, the astute trader, observing ADX would notice that the indicator is below 30 signifying that we may not be looking at a trend; or at the very least that the trend may not be considered strong.
Shortly after the reversal to the upside takes place (despite price still being below the 200 period SMA) ADX begins its run, climbing above 30 and eventually rising to over 50 indicating the strong trend.
Traders looking to employ trend strategies, or placing trend trades, can simply filter trade ideas with the ADX indicator.
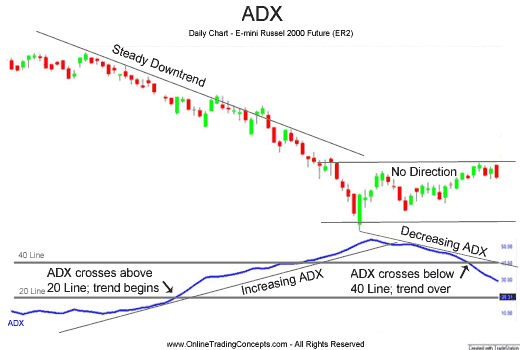
The below image shows ADX with notes as to how traders can potentially look to incorporate this indicator into their approach.

If ADX is above 30 the trader can then look to trade trends with their trend strategies. If ADX reads below 30 the trader can look to ignore potential trend trades, as any trends exhibited on the chart have not registered as strong.
The important thing to keep in mind with ADX is that while it can be a great tool for indicating trend strength, it will never show the trader the direction of the trend.
— Written by James B. Stanley
To contact James Stanley, please email Instructor@DailyFX.Com. You can follow James on Twitter @JStanleyFX.
To join James Stanleys distribution list, please click here.
DailyFX provides forex news and technical analysis on the trends that influence the global currency markets.
Learn forex trading with a free practice account and trading charts from FXCM.


