ADX Indicator explained
Post on: 2 Апрель, 2015 No Comment

The ADX indicator analyzes the strengths of the trend; the MACD/OsMA analyzes how likely the trend is. ADX means the Average Directional Index and was developed in 1978 as an indicator of trend strength in a series of a financial instrument.
How to Use ADX Indicator
The ADX indicator is used to quantify the strength of a trend. It calculates using a moving average of price range expansion over a certain period of time. By default an ADX indocator is set at 14 bars, but that can usually be adjusted in the trading platform of choice. The ADX indicator can be used with any type of trades: stocks, shares, funds, indices, forex. commodities. etc.
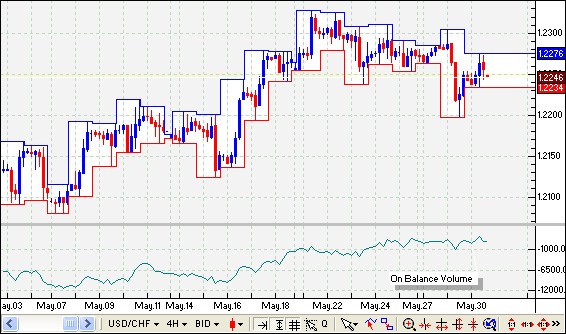
In the figure below you can see a screenshot of my free demo account with Plus500. In the lowest chart you can see three lines: a green, blue and red one. The dark blue line is the ADX indicator line.
Interpreting the ADX works as follows. A rising ADX means that the markets trend will rise and you can do best by apply a trend following system. A downward trend indicates a flat ADX.
An increase of the ADX through the 20 boundary, indicates that there is a new trend is going to take place. Above 20 or 25 is often confirmed by the trend. Wanner, the ADX above 40 opens and then goes down here again, this means that the trend is weakening and a fall can take place again.
NOTE: the ADX indicator going up does not mean the rate is rising, it meas that the rate shows a trend!!
The ADX indicator is is derived from the DMI indicator, Directional Movement Indicator, which is also developed by the same person responsible for the ADX indicator. The DMI, with help from for example ADX, tells whether the instrument is trending or not.
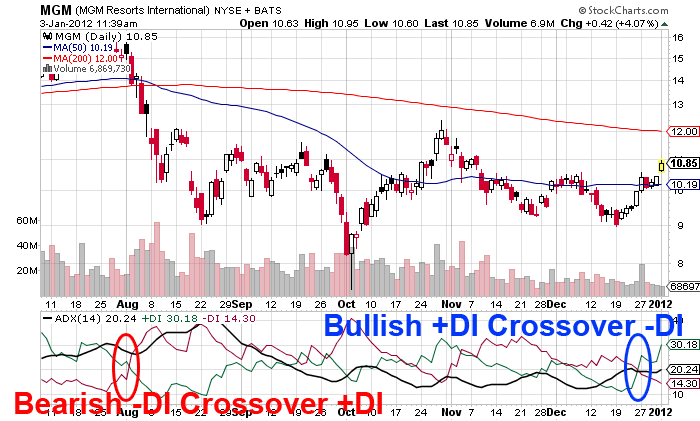
In the screenshot you can see two DMI lines. The green line is the +DMI and the red is the -DMI. When the -DMI is above the +DMI, prices are moving down and when the +DMI is on top of the -DMI the uptrend has shown.
Technical Indicator ADX

The ADX indicator has certain a value in the range of a minimum of zero to a maximum of 100, indicating ist weakness or strength. This is an overview of the ADX values and trend strength:
In summary: when the ADX value is between 0 and 25 there is no trend at all. When the range is below 25 for at least 30 bars the price enters a range conditions and price patters which are often easier to identify. From low ADX indicator conditions, the price will eventually break out into a trend.
NOTE: a falling ADX trend line means that the trend is strenght is weakening.
How to Trade the ADX indicator: Conclusion
The most important signal on a chart is the price. First you should read the price, second the ADX indicator to determine what the price is doing. Using an indicator like ADX is only handy when it adds something that the price itself doesn;t tell us. The best trend rise out of periods of price range consolidation. A disagreement between the buyers and sellers price are the reason for a breakout. Price momentum differences are created whether there is more supply than demand or more demand than supply.


