A GBP
Post on: 29 Март, 2015 No Comment

Talking Points.
- The Weekly Uptrend in GBP/AUD A Good Zone for Buying the Uptrend Pinpoint Entry on the 4-Hour Chart 4 Trade Scenarios Most Likely to Play Out
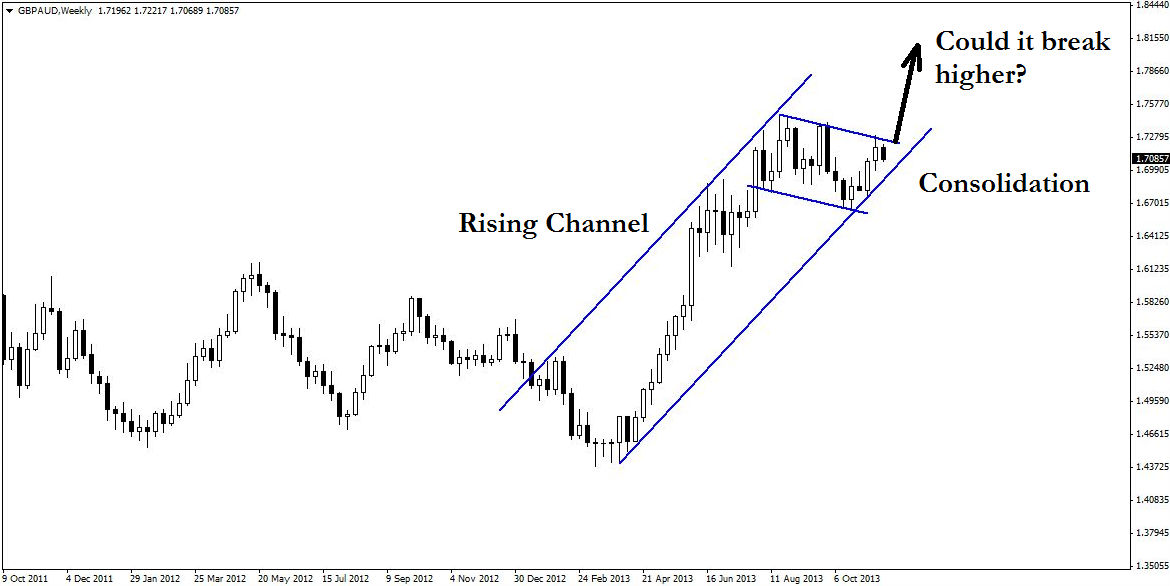
By any definition, GBPAUD is in a weekly uptrend, as seen on the chart below. The monthly chart paints a slightly different picture for the pair, but for the purposes of a swing trade, it has pulled back to a very reasonable location on the chart.
Guest Commentary: Weekly Uptrend for GBP/AUD
Readers will note that the rising trend line is artificial and was copied and pasted as being parallel to the line defining the upper end of the channel. Price is now at a crucial level for this trend. Should the support hold, the trend will remain intact, but if not, this could become a consolidating market or one that is potentially turning down.
This level also presents juicy swing trade opportunities for the lower time frames.
Guest Commentary: Daily Chart for GBP/AUD
The daily chart proves even more interesting, as the 0.618 Fibonacci retracement level, drawn from the segment marked on the chart, is coinciding with where price is at the 1.6657 price level. Although this taken by itself is insufficient basis for a trade, a general support zone between the Fibonacci level and the rising trend line (plus some room for error) may be anticipated: 1.6487-1.6657 (marked in blue).
This 170-pip zone should prove interesting to anyone looking to buy the uptrend on the weekly GBPAUD chart. In addition, the stochastic is oversold, although it has remained below the 20 level for a few days now, showing that there is considerable countertrend momentum pushing price down on the lower time frames.
Of course, much tighter risk control is desirable, and the four-hour chart provides more insight into how to enter the trade.
Guest Commentary: Enter Based on 4-Hour GBP/AUD Chart

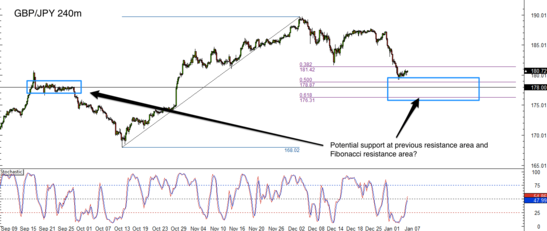
There is a downtrend in play on the 4-hourly charts which must be accounted for, because although the trade is with the weekly trend, there may be some last-minute surprises. The steady downward movement strongly suggests that the support zone will be tested again as price moves further down in a final burst. As a result, the entry on the four-hour chart will depend on how price reacts when it gets there.
The following scenarios are possible:
- Price spikes up, breaking the declining resistance trend line, and then drops into the support zone before turning higher. This would give a classic bullish reversal divergence with an oscillator like the (8,3,3) Stochastic or the RSI(14). That would be an ideal buy scenario. Price may not break the trend line, but instead decline immediately into the support area. In this case, a bullish reversal divergence would also be a buy, but traders should anticipate some choppiness before price turns around. This could be dealt with either by using larger stops at the bottom of the support zone, or using smaller, hair-trigger stops, although that method might require two or three attempts in order to successfully get into the move. Price moves into the support zone and bounces up to break the trend line without giving the trader a chance to enter. In this scenario, an inverse head-and-shoulders pattern would be anticipated, and the trader should have a second chance as price dips to form the inverted right shoulder of the pattern. As in all scenarios, price could suddenly gain momentum and bulldoze right through the support zone. In this case, the chances are good that the reversal divergences mentioned above would not occur. Even if they did, the trader would likely only take a small stop out, which is acceptable considering the potential reward this trade offers (even an average weekly move up could contain more than 200 pips).
There are several other possible scenarios, but these are the ones which are most likely to develop given traditional GBPAUD price action.
By Kaye Lee, private fund trader and head trader consultant, StraightTalkTrading.com
DailyFX provides forex news and technical analysis on the trends that influence the global currency markets.
Learn forex trading with a free practice account and trading charts from FXCM.


