4 Divergences Trading System
Post on: 7 Август, 2015 No Comment

A very popular and interesting style of trading selected by more and more traders on the financial markets is the so-called “divergences”. Such unique method of trading offers a very interesting percentage of successful trades to the contrary of loss-incurring ones, nevertheless, it regards rather a discretion trading than the loss ones based on strictly set rules which would only mechanically be observed.
The majority of technical indicators monitor a course of the price in a various manner and the prices are then determined in connection to such course of action. Should the prices go up and increase, the indicator reacts on such fact in the same way and starts increasing as well. If the price movement slows down or the price turns around, the indicator reacts again in the same manner and turns the same direction as shown by the pricing movement.
One of the instruments for confirmation of the set trend is applying divergences between an indicator and price. Using hidden divergences may primarily represent an interesting percentage ratio of gaining and loosing trades.
The majority of a literature available examines only the so-called “regular divergences” predetermining for us a potential change in a trend and being for sure the excellent “weapon” in trading.
In order to expand our trading system and securing a greater profitability and partial diversification, we will include the Hidden Divergences as well. In such case, this does not concern searching for a possible change in the market direction but to the contrary, for confirmation of the set trend.
The principal advantage of the Divergences is no doubt the stability of this particular trading style having been proven over several dozens of years. Due to the fact that the markets are subject to changes over time, we traders are forced to become more perfect or flexible enough to adjust our trading tactics to the market behavior.
1 Regular Divergences
What do we mean by “regular divergence ”? For the sake of simplicity, we will select the generally known terms, i.e.the“Bull Divergences ” (to the long position) and the “Bear Divergences ” (to the short position).
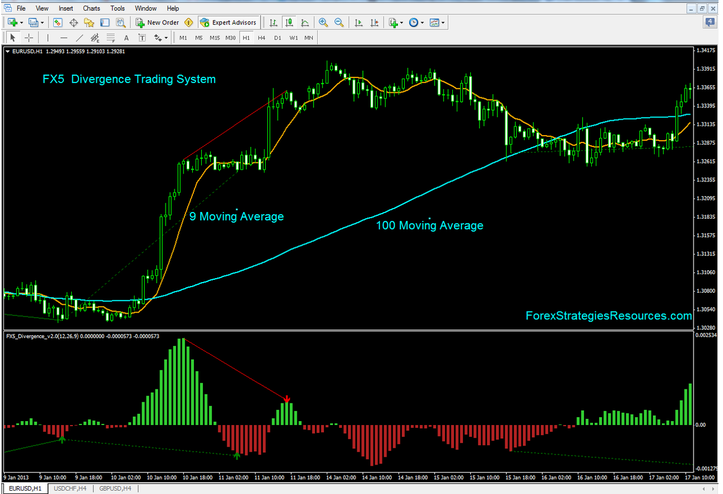
The Bear Divergences are created under assumption that the first pricing maximum is set after which a correction to the opposite direction follows along with the second pricing maximum thereafter (i.e. higher than the previous maximum) to a direction of the first one. In order to have such pricing event become a divergence it must be accompanied by an oscillator having created the maximum at the first pricing maximum but lower maximum at the second higher pricing maximum.
The Bull Divergences are created if the first pricing maximum is followed by correction to the long position and the second pricing minimum thereafter (i.e. lower than the previous minimum) to a direction of the first one. As in case of the Bear Divergence, it is necessary to create the minimum on the oscillator at the first pricing minimum but the oscillator shall create the higher minimum at the lower pricing minimum thereafter.
Picture No. 3 Regular Divergence
The currency pair –- EURO/USD – traded on the FOREX market with setting a timing period for one hour. The MACD (Moving Average Convergence Divergence) Indicator is then added in the bottom part of the Graph with periods of time set at 12, 26 and 9.
The Hidden Divergences are traded to a direction of the trend established, therefore, in case of a inclining trend, we search for trades to the long position (purchase) and in case of a declining trend, we search for trades towards the short position (sale).
In case of the Hidden Divergences, whether Bull ones or Bear ones, the trend pending gets confirmed. The signal is established under assumption of a diverging situation on the market to be taking place in the form of a deviation from the price and indicator towards a direction of the trend. In such case, a greater point of the turn in the pricing graph has to be created in the uptrend than the previous one and, at the same time, it gets confirmed on the oscillation indicator by a lower point of turn than at the previous bottom. The Picture below explains the foregoing well in the graphic form.
Picture No. 4 Hidden Divergences

The currency pair – EURO/USD – traded on the FOREX market with setting a period of time for one hour. The MACD Indicator is then added at the bottom of the Graph with periods of time set at 12, 26 and 9.
The Divergence referred to as Number One shows the first of the series of successful Hidden Divergences created by interconnecting the lower and higher pricing bottom and, at the same time, the higher and lower point of the turn on the MACD Indicator. The subsequent trades numbered as two and three are created in the identical manner.
The example below shows using the both kinds of Divergences in practice applying the realistic data from the market so that their potential complex use within the trading plan is obvious, therefore, not only trading within the trend but also searching for potential points of the trend of turn occur.
Picture No. 5 Hidden and Regular Divergences
The currency pair – EURO/USD – traded on the FOREX market with setting a period of time for one hour. The MACD Indicator is then added at the bottom of the Graph with periods of time set at 12, 26 and 9.
The EURO/USD Graph indicates both kinds of Divergences, i.e. the Regular one as well as the Hidden one. It is clear from there in what manner a development on the market may be predicted to a certain extent upon trading such formations. The full lines indicate the Classical Divergences assuming a change in the trend and dot-and-dash points of the turn for the Hidden Divergences. The arrows indicate an anticipated direction of the market, i.e. trade, to which it would be entered.
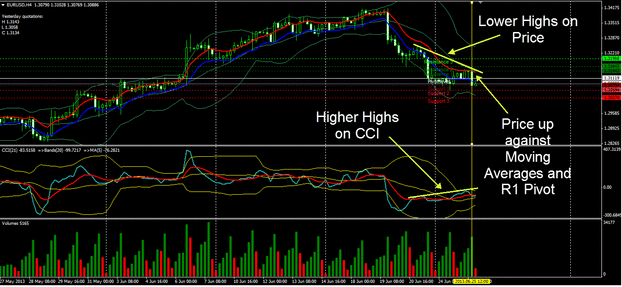
The indicators usable for monitoring Divergences are of an enormous quantity. In general, they should be established on an oscillation basis so that they would record different deviations from the pricing developments and indicate so potential points of the turn, confirmation of the pending trend, in particular. Among the basic and most popular indicators used for monitoring Divergences are MACD, Stochastic, RSI, Momentum, CCI and others.


