Archive for FOREX
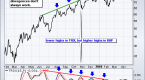 Momentum and divergence for successful Forex trading
Momentum indicators such as the Relative Strength Indicator (RSI), Stochastic oscillator and the Moving Average Convergence/divergence (MACD) indicators can be used very effectively to
9 Апрель, 2015 No Comment Read More
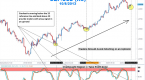 Learn Forex SwingTrading Trends with Stochastics
Article Summary: Trading trends can be one of the most desireable market conditions when trading FX, as long-term deviations between economies can create elongated
9 Апрель, 2015 No Comment Read More
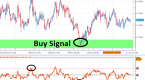
 FREE Forex Binary Options System That Uses Bollinger Bands And Stochastic Oscillator!
March 25 2013 You can use this strategy for scalping as well as trading binary options. Binary Options are much easier to trade as
9 Апрель, 2015 No Comment Read More
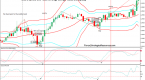
 Blockade With Polarity Oscillators MetaTrader Expert Advisor
The forex blockade trading strategy is one of the simplest ways for disciplined independent traders to profit from currency price moves. It’s a great
9 Апрель, 2015 No Comment Read More
Talking Points: Every trader should have a method of identifying potential Forex trades. Identify Swing highs and lows to find the trend. RSI overbought
9 Апрель, 2015 No Comment Read More
 What is a Japanese Candlestick_1
Forex Links The most popular concept to study Forex charts is Japanese Candlestick. Japanese Candlestick is so named because the concept of candlesticks was
9 Апрель, 2015 No Comment Read More
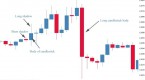
The Candlestick is absolutely key to understanding forex price action Candlestick Charts have become the norm in forex trading for the simple reason that
9 Апрель, 2015 No Comment Read More
Words and Expression: Figures are like words. Thousands of word spoken may make them difficult to comprehend. Charting those figures is like expressions. A
9 Апрель, 2015 No Comment Read More
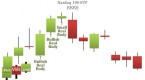
 Candlestick Chart The Stock Charting Edge
This type of chart is a specialized category of technical analysis. A candlestick chart is used to describe price movements in financial instruments like
9 Апрель, 2015 No Comment Read More
It’s not too often that tools of financial analysis have a near-mythical origin. In the forex market, however, the most common graphs are referred
9 Апрель, 2015 No Comment Read More
Follow Us
Connect with Us
![]()
![]()
![]()
Sidebar Post
- Most Popular
- Recent Comments
Featured Posts


Popular Posts
- #1 Country For Tech StartUps U S A - by ip on 3-16-15
- Food technology startup YuMist raises Rs from VC firm Orios Venture Partners Economic - by ip on 3-16-15
- Mass exodus Tech startups may shift overseas as young ventures face regulatory hurdles in India - by ip on 3-16-15
- Number One Country For Tech StartUps U S A - by ip on 3-16-15
-

Bollinger Bands Strategy With 20 Period ...
-

Pay Off Your Mortgage Prior To Retiremen...
-

You Say You Want A Dissolution An Overvi...
-

Pay Down the Mortgage Before Retirement ...
-

Volume indicator
-

Uncover Value Opportunities Using the Pr...
-

The Strategic Sourceror Top Tips for Rec...
-

How to pay off debt
-

Recessionproofing retirement
-

Frontier Markets The New Emerging Emergi...