VALUECRUNCHER Comparable company valuations
Post on: 8 Май, 2015 No Comment

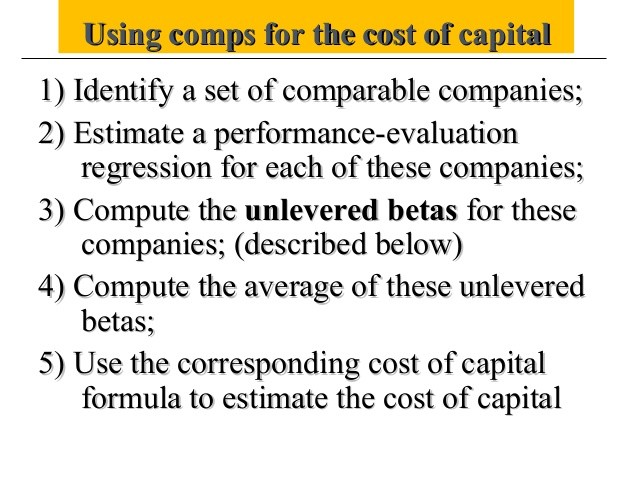
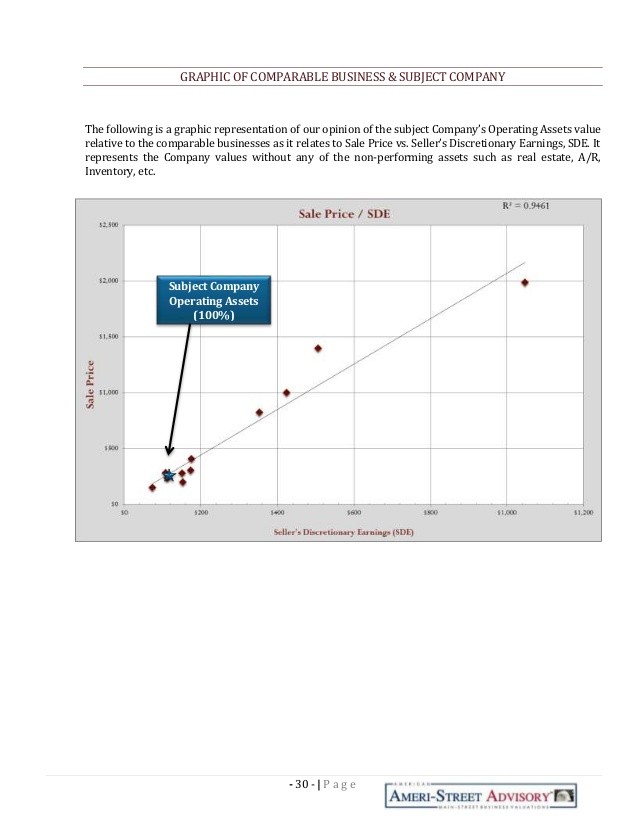
Where DCF (discounted cash flow) focuses on the specific characteristics of the company being valued comparable company analysis uses a relative approach. This relative approach values the company based on the market valuation of similar companies.
Comparable company valuation uses the valuation ratio of a publicly traded company and applies that ratio to the company being valued. The valuation ratio typically expresses the valuation as a function of a measure of financial performance (e.g. revenue, EBITDA, EBIT or Earnings Per Share), occasionally operating metrics such as number of employees, customers or register users will be used in valuation ratios. The valuation figure used generally reflects the enterprise value (EV) or the value of the equity in the business; the equity value is usually represented by the share price.
Calculating valuation multiples
Each methodology has its individual positives and negatives and it is important to note that the valuation multiples are not consistent across methodologies.
Valuation Measures: Equity versus Enterprise Value (EV)
Using ratios based on the equity value such as price/earnings (P/E) can be distorted when a company holds a significant cash reserve. An example of this Microsoft who has approximately $25 billion of cash and cash equivalents on their balance sheet, this will contribute to Microsoft having a higher P/E ratio than a comparable company with lower levels of cash reserves. The P/E ratio remains a popular metric amongst investors and analysts because it can be calculated quickly using the company’s share price and earnings per share. It is important to recognise that this valuation ratio relates to the value of the equity in the business and can be distorted by balance sheet items and accounting definitions of earnings. Using EV as valuation parameter for the comparable company analysis limits the impact of capital structure and significant cash reserves on the valuation ratio. The EV for a listed company is calculated as:
EV = market capitalisation + (long-term debt – cash & cash equivalents)
Financial Performance Measures: Revenue (Sales), EBITDA and EBIT
EV comparable company multiples are typically expressed as a function of revenue or earnings. Revenue based multiples such as EV/revenue have limited validity for comparable company valuations, they rely on the comparable companies having equivalent profitability margins. Using the EBITDA or EBIT figure to calculate the valuation multiple limits the impact of different profitability margins on comparable company analysis. The choice between EBITDA and EBIT often depends on the characteristics of the company. Where depreciation and amortisation levels are similar to capital expenditure EBIT is the appropriate measure. When capital expenditure is “lumpy” and varies from depreciation EBITDA is our preferred performance measure. EBITDA and EBIT are preferred over alternatives such as net profit after tax (NPAT) as they exclude the impact of leverage and unique taxation features.
Historic versus Forecast Performance
Both the PE ratio and EV based ratios have a number of variations. One of the most common variations is the time period used. Generally one of three time periods is used, last financial year (LFY), trailing twelve months (TTM) or forecast. The LFY and TTM measures utilise actual historic data with the TTM months generally being the most relevant to a valuation today. LFY is the most available number and what we use at Valuecruncher. Forecast based valuation multiples are more applicable for firms in the process of a high growth phase. Where the market has incorporated significant revenue and earnings growth for the next year into today’s price the valuation multiple based on historic performance will be biased upwards. Using the forecast data reduces the impact of different expected short-term growth rates on the valuation multiple but relies on the availability of forecast data.
What factors drive the variance in comparable company valuation multiples?
Where the samples of comparable companies share the same industry and operate in the same geographical region the variance in valuation multiples will be due to company specific factors. The key company specific factors that drive valuation are:
The growth opportunities available to a company are a key valuation driver, using forecast revenues and earnings can reduce the impact of different short-term growth opportunities. Generally companies with greater growth potential will have higher valuation multiples.

The different risk profiles of each of the comparable companies will impact on their individual valuation multiples. The higher the risk associated with the company’s cash flows the lower the valuation multiple will be.
Capital expenditure
The projected capital expenditure profiles of each of the comparable companies will impact on their individual valuation multiples. The higher the expected capital expenditure the lower the valuation multiple will be, all other things being equal (which they very rarely are). It is important to remember capital expenditure often results in increased capacity, sales or profitability, all of which have a positive impact on value.
Takeover issues
Valuation multiples of companies involved in a takeover process can be distorted. This distortion often arises in the form of an inflated valuation reflecting a premium included in the takeover price. This premium may be the function of a financing (private equity driven transactions) or synergies expected to result from the transaction.
International Comparable Companies
Alternative international markets with varying competitive and regulatory environments can impact on valuation multiples. This does not render international comparable company valuation multiples invalid but applying and interpreting them requires additional care.


