Using Technical Indicators For Financial Spread Betting
Post on: 16 Март, 2015 No Comment

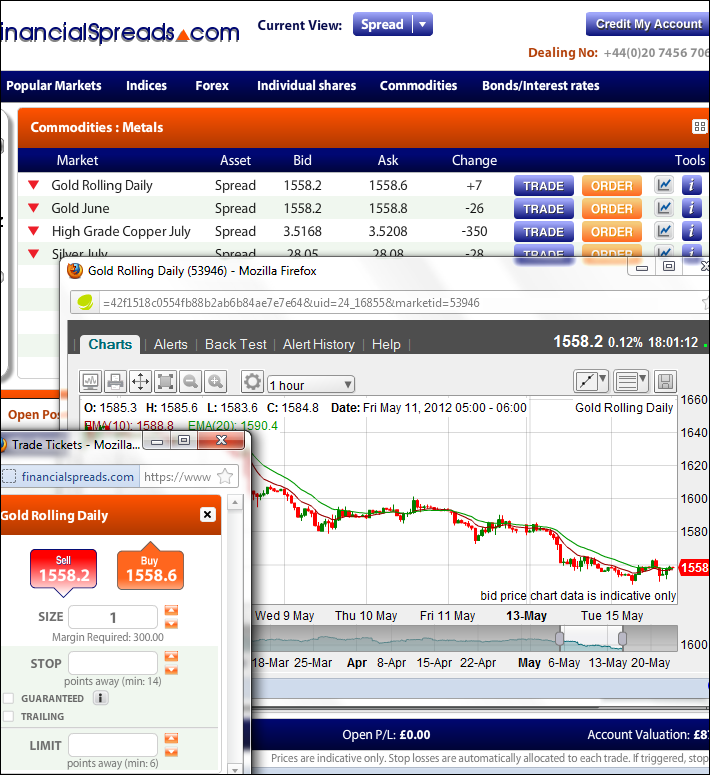
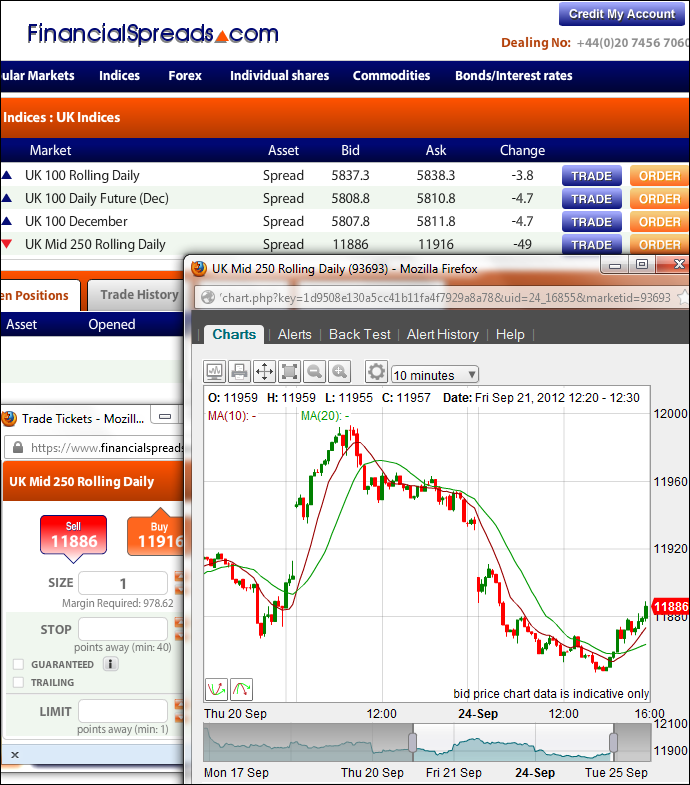
First popularized in sports betting, financial spread betting is a speculative strategy used by advanced investors. Classified as a derivative, the value of spread bets are derived from the movement of one or more underlying asset.
Provided a spread, an investor can speculate on whether the price of an underlying asset will rise or fall. Financial institutions offer investors a spread which is the difference between the bid and ask price of a security. Investors position their investments with the bid price if they believe the market will rise and the ask price if they believe the market will fall.
Through technical analysis, many spread bettors utilize multiple indicators to identify trends in prices and volume of trades. A number of indicators such as Moving Average Convergence Divergence (MACD), Relative Strength Index (RSI), Average True Range (ATR) and Average Directional Index (ADX) exist for spread bettors to analyze historical trends for future investments. (For more, see: Understanding Financial Spread Betting .)
Technical Analysis
Technical analysis. as opposed to fundamental analysis. is most often used to analyze and forecast the price direction of a security or asset. Through the analysis of market data, in particular price and volume, technical indicators are utilized to predict future price changes.
Technical analysis follows the belief that history tends to repeat itself. By incorporating a number of indicators, technical investors seek historical and future price trends that can be used to gain positive returns.
Loading the player.
Moving Average Converge Divergence (MACD)
Developing profitable returns with spread betting involves understanding and incorporating technical indicators in an investment strategy. The moving average convergence divergence indicator is a common technique utilized to predict changes in the trends of a market.
MACD utilizes moving averages over a particular time frame to smooth movements in the market into a single trend line. In particular, spread bettors forecast whether entry or exit is necessary in a trade.
MACD indicators are calculated based on exponential moving averages (EMA) of 26 days and 12 days. Subtracting the value of the slow 26 day EMA from the fast 12 day value signals whether to buy or sell. When the MACD trend line converges to the EMA line, the chart signals it’s time to buy. When when the trend line diverges from the signal line, an investor is expected to sell.
Relative Strength Index (RSI)

As a technical indicator, the Relative Strength Index (RSI) is utilized to determine whether a security is overbought of oversold. As a means to determining entry and exit, an asset is deemed as overbought when the RSI approaches 70 out of 100. Likewise, an RSI of 30 out of 100 indicates an undervalued asset.
Divergence between prices and RSI indicate to spread bettors whether a future trend reversal is forthcoming. When prices fall, the Relative Strength Index is expected to do the opposite indicating a change in trend for spread traders. The opposite can be said during upward price trends. On its own, the RSI can create false buy or sell signals; however, in conjunction with other technical indicators the RSI can be a powerful tool.
Average True Range (ATR)
Spread Bettors can utilize the Average True Range indicator to determine the volatility of an asset. The ATR identifies and determines the trend highs and lows of an asset. As with a mathematical range, the Average True Range is calculated by subtracting the daily high from the daily low. Values in the range are then calculated on a moving average basis, typically over 14 days.
A low ATR indicates constant price levels and low levels of market volatility. Conversely, a high ATR indicates volatility in the market. Spread bettors utilize Average True Ranges to determine when big- ask spreads should be closer or wider. An investor is unlikely to enter a contract with a wide spread if the ATR indicates low market volatility.
The Bottom Line
As a popular tool of investing in the United Kingdom, spread betting encompasses the buying or selling of an underlying asset when a strike price is met. Gaining consistent profits in financial markets, in particular spread bets, is strictly due to chance; however, through technical analysis, past and current trends can dictate whether history will repeat itself.


